


The interdependence of the general trend of the crypto index and the US economy


Introduction
Despite the seemingly obvious differences between the traditional financial system and the new crypto-financial system that began the evolution of web 3.0, we are faced with a problem feared by the first geek underground, which used bitcoin to buy and sell everything from servers to mobile phone jammers. The problem is a decentralised, all-accessible system depending on a centralised fiat economy — an economy steadily becoming obsolete. In general, the interconnection between these areas is growing every day. The complicated part is losing the identity and sovereignty of a unique, independent, and safe oasis even as it opens new opportunities and attracts new capital.
To understand this phenomenon and its relevance, let’s review how events have unfolded since the birth of the relationship between the main crypto-index — bitcoin — and the US financial market.
Before 2015
In 2014 American entrepreneur Jess Powell spoke with about 30 US banks in an effort to open an account for the new Kraken virtual currency exchange. Such exchanges need a bank account primarily to receive money transfers and checks from customers, which are then exchanged for virtual currency. Unfortunately, Powell did not get the support he needed from US banks, so he resorted to using the services of a bank in Germany [link].

The statistics below show the relationship between the S&P 500 and BTC and one (of many) news above.
- Correlation in close prices between 2014 and 2015 = -0.2893324981872364
- Correlation in volumes between 2014 and 2015 = 0.21745645033928715
- Correlation in open prices between 2014 and 2015 = -0.27755695743569037


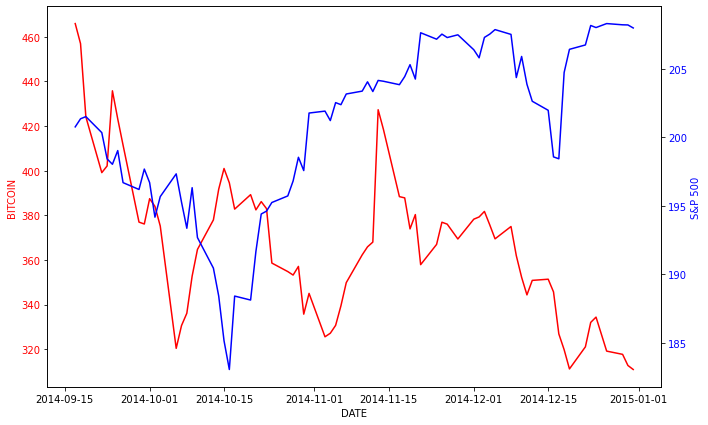
Until 2015, the relationship between the S&P 500 and Bitcoin was negative, indicating the transition of dark horses from the US market to the crypto sphere and the creation of fundamental protocols and projects in the crypto industry, or there was no correlation. This was also true of the NASDAQ:
- Correlation in close prices between 2014 and 2015 = -0.3303598974828471

- Correlation in volumes between 2014 and 2015 = 0.27200963778113124

- Correlation in open prices between 2014 and 2015 = -0.3173866970529927

The beginning of a relationship
In 2015, the state of affairs began to change. Weak relationships developed between the US market foundations and the blockchain world:
- The year began on a shocking note on January 5th, when bitcoin exchange Bitstamp released a statement admitting a significant hack had taken “less than 19,000 BTC,” or about $5.1 million at the time [link]:

- That same January, Megabank joined Coinbase’s record $75M funding round [link]:
- In March 2015, former JP Morgan chief executive Blythe Masters took over as CEO of bitcoin trading platform Digital Assets Holdings (DA). Masters told the Wall Street Journal, “Digital Assets has a revolutionary technology platform that eliminates the counterparty risk and lack of transparency that hinders the mass adoption of cryptographic technologies. The opportunities to reduce costs and risks in settlements are enormous.” [link]
This news may have caused a multifaceted reversal effect — which was natural because this was seen as a doubtful move for Wall Street and a significant benefit for blockchain technologies. No other news from that period would have caused such correlated movement.
Other news from the time that indicated a logical link between the markets:
- Global stock market giant NASDAQ unveiled its research into how blockchain solutions could change how shares are transferred and sold. Nasdaq was the “last” big financial group to announce its interest. Still, it soon became the most productive in sparking public interest in its blockchain research and development. [link]
- The New York State Department of Financial Services (NYDFS) released the final version of its long-awaited regulatory framework for digital currency companies. This release of the BitLicense followed nearly two years of fact-finding and debate. NYDFS began developing rules after deciding technology should not be regulated by current state law [link].
- On Sept. 9, startup Chain announced that it raised $30 million in new funding from investors including Visa, Capital One, and Fiserv — an impressive number indicative of the growing recognition of the benefits of blockchain technology [link].
Around this time, the blockchain went from a tool to pay for porn and casino debts to a new, decentralised financial system that Wall Street and the US government had to reckon with, a system they could not leave without controls.
Correlation indicators from the period were low, indicating weak interconnections between the markets, but the connections are there. Moreover, as we will see, these indicators became evident in the following years.
S&P 500 and BTC correlation indicators:
- Correlation in close prices between 2015 and 2016 = 0.10282429894879809
- Correlation in volumes between 2015 and 2016 = 0.07487506485850948

- Correlation in open prices between 2015 and 2016 = 0.11957142125537704

At this point, there was a stronger correlation between BTC and NASDAQ than with the S&P 500. This was due to the news noted above:
- Correlation in close prices between 2015 and 2016 = 0.3719658129665443

- Correlation in volumes between 2015 and 2016 = 0.08722538168109174

- Correlation in open prices between 2015 and 2016 = 0.385489628574494

Important moments
2016 was one of the most favourable years for blockchain technology. Hype only grew as large enterprises invested heavily in distributed ledger and blockchain technologies. Frustration increased as established cryptocurrencies — most notably Bitcoin — continued to struggle with mainstream adoption while facing complex technical challenges:
- The second cryptocurrency phenomenon: the Ethereum blockchain project launched its first production version. After the first release — Frontier — in 2015, the Ethereum blockchain platform released its first production version, dubbed Homestead, in March. Against a surge in market capitalization and rising value, large companies began calling Ethereum “Bitcoin 2.0”, taking to the technology with rare enthusiasm. As a result, Crypto asset diversification became as crucial as stock diversity.
- Bitfinex, an online digital currency exchange service, was hacked in August 2016. This was the second-largest bitcoin exchange platform hack at the time. 119,756 bitcoins worth about $72 million at the time were stolen [link]:

- Bitcoin halving in 2016 did not seem to cause much resonance, but charts revealed the same movement across two markets:
- Then there was the DAO attack that led to the theft of $60 Million in Ethereum [link]:
By 2016 the overall correlation between crypto and fiat was obvious and associated with sharper reactions to important events in both markets.
See the following S&P 500 and BTC indicators:
- Correlation in close prices between 2016 and 2017 = 0.8013923516092443
- Correlation in volumes between 2016 and 2017 = -0.000848419741890224

- Correlation in open prices between 2016 and 2017 = 0.8061565260485413

NASDAQ-BTC Correlation Metrics:
- Correlation in close prices between 2016 and 2017 = 0.7944711114911134

- correlation in volumes between 2016 and 2017 = 0.050010024929640434
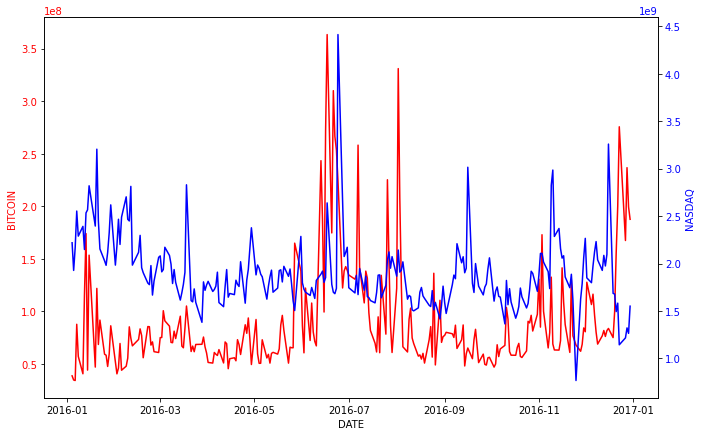
- correlation in open prices between 2016 and 2017 = 0.7962654701746794

Skyrocketing
2017 began with China’s National Bank implementing a policy of tightening its oversight of the country’s dominant bitcoin exchanges. It was a disappointing start to the year. However, even considering the US economy’s dependence on China, this event did not have the expected correlation effect.
In March 2017, the US Securities and Exchange Commission (SEC) rejected an application by investors Cameron and Tyler Winklevoss to launch a bitcoin exchange-traded fund. The markets reacted poorly. Many were betting that the US regulator would approve rather than reject the proposed ETF [link]:

The “summer of the bulls” followed, caused by a favourable mood in the market. It is essential to understand that by this time, a positive outlook in crypto meant a good attitude in the stock market — and vice versa:
“By the first week of September, the price of bitcoin topped $5,000 for the first time but fell hundreds of dollars two days later. Indeed, in those days there was a pullback from the achievements of the end of summer: the price of the cryptocurrency fell below $3,400 on September 14 and exceeded $3,000 the next day.” [link]:
Bitcoin’s price set a record then, and this correlated with the price movement of the NASDAQ and S&P 500.
Overall correlations were still holding up as well as the NASDAQ:
- correlation in close prices between 2017 and 2018 = 0.8167350443560699
- correlation in volumes between 2017 and 2018 = 0.030251101583248067
- correlation in open prices between 2017 and 2018 = 0.8152467666494251
… and in the S&P 500:
- correlation in close prices between 2017 and 2018 = 0.8705376216374139
- correlation in volumes between 2017 and 2018 = 0.11071985886609985
- correlation in open prices between 2017 and 2018 = 0.8712886398674531
Decisive turning point
2018 was an exciting year for looking at the relationship between the US economy and crypto. It was the first year since 2015 that the correlation between the United States Fed Funds Rate and Bitcoin has reversed:
- from 2015-01-01 to 2016-01-01 correlation between close price for BTC and United States Fed Funds Rate is 0.5487733110424662
- from 2016-01-01 to 2017-01-01 correlation between close price for BTC and United States Fed Funds Rate is 0.6407724089837648
- from 2017-01-01 to 2018-01-01 correlation between close price for BTC and United States Fed Funds Rate is 0.683662086598349
That is, from 2015 to 2018, the relationship was direct, suggesting that as the Fed Funds Rate increased, the bitcoin price also increased. Rate increases have typically led to a drawdown in the stock market. But it is also important to note that 2018 was the first year since 2015 when the correlation between the NASDAQ, S&P 500, and Bitcoin became (on average) almost zero:
- S&P 500:
- correlation in close prices between 2018 and 2019 = 0.12118602229247982
- correlation in volumes between 2018 and 2019 = 0.12656217826865054
- correlation in open prices between 2018 and 2019 = 0.10633778327729097
- NASDAQ:
- correlation in close prices between 2018 and 2019 = -0.03525002263223522
- correlation in volumes between 2018 and 2019 = -0.05662443995110041
- correlation in open prices between 2018 and 2019 = -0.055236190871095894
In addition, the correlation between the NASDAQ and the United States Fed Funds Rate until 2018 was also direct, which means that once the rate rose, the price of both assets also increased. This was strange because it should have been the other way around. This tells us the US economy was undergoing a recessionary reversal trend. Therefore, the refinancing rate increase began acting as a real constraint, making the economy more expensive to consume and reducing the amount of investment. Investor awareness of the weakness of the US financial pyramid and a decrease in the amount of investment may have led to a reduction in the price and amount of money. It was then necessary to continue printing unsecured fiat. This would have led to a continued rate increase and a greater investment decrease.
These relationships are complex. Given the sharp reversal of US macro data and both markets, the point is that the US Index of Consumer Sentiment was reaching a point of no return:
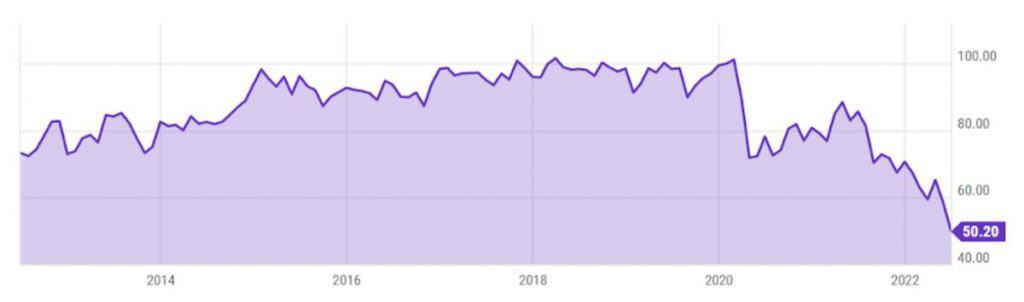
[link]
And indeed, the index grew until 2018, remained level in 2019, but then went down.
The reason for the almost zero correlation between markets is connected directly to unpleasant but cyclical events in the cryptocurrency sphere.
As Bloomberg reported, “The chilling term refers to a sharp slump, followed by a drop-off in trading and months of market doldrums — a phenomenon that memorably befell the crypto market in 2018. Bitcoin’s price plunged by more than 80% to as low as $3,100 from the end of 2017 through December of the following year, a period characterised by the boom-and-bust of initial coin offerings and several big banks shelving their plans to start cryptocurrency trading desks. Bitcoin wouldn’t reach a new high until December 2020…” [link]
The US stock market was still at a relatively weak level of confidence from local and overseas investors.
Back to the correlation
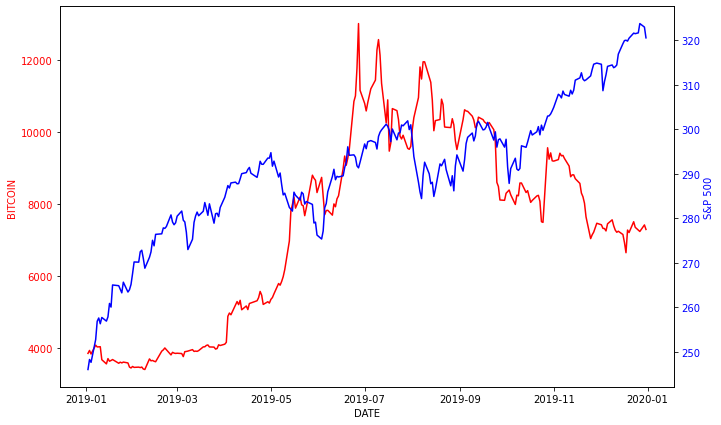
2019 was a great year for bitcoin as the main crypto index because it was recognized as the most effective asset:
- Bitcoin – According to Messari, the price ended the third quarter at $8,308 apiece, up 114% year over year [link].
- Stocks – the yield of the Standard & Poor’s 500 index by September 30 was 21% [link].
- Gold is up 17% since December 31st [link].
- Bonds – The yield on 10-year US Treasuries is only 1.6% [link].
Starting from 2019 through 2022, there has been a strong correlation between the NASDAQ, S&P 500 and the main cryptocurrency. Additionally, the correlation between the United States Fed Funds Rate and the first crypto has grown steadily negative (inverse). That is, now the main index of the crypto world behaves much like the US stock market — until now the main index of the world economy.
2019 S&P 500 Correlation Metrics:
- correlation in close prices between 2019 and 2020 = 0.5499284151007043

- correlation in volumes between 2019 and 2020 = -0.2783588692481716

- correlation in open prices between 2019 and 2020 = 0.5602337463500764
According to NASDAQ:
- Correlation in close prices between 2019 and 2020 = 0.5171092975761752

- Correlation in volumes between 2019 and 2020 = -0.15245886873148543

- Correlation in open prices between 2019 and 2020 = 0.5295271744603843

COVID-19 break
2020 was a fateful year for humanity. On January 30, 2020, the World Health Organization declared the COVID-19 outbreak a Public Health Emergency of International Concern. On March 11, it was declared a pandemic.
The price trajectory of bitcoin in 2020 changed due to its growing use as a hedge against the possible currency depreciation that could come from trillions of dollars of coronavirus-related stimulus payments from central banks and governments worldwide. However, even though bitcoin became even more popular in 2020, recognized by investors and ordinary people as a reserve asset that does not depend on the decline of the economy, the correlation value remained at a reasonably high level:
S&P 500 and bitcoin:
- correlation in close prices between 2020 and 2021 = 0.7675445594367286
- correlation in volumes between 2020 and 2021 = 0.33534766994797166
- correlation in open prices between 2020 and 2021 = 0.7705452812731232
NASDAQ and bitcoin:
- correlation in close prices between 2020 and 2021 = 0.8261882028300777
- correlation in volumes between 2020 and 2021 = 0.03448907250809857
- correlation in open prices between 2020 and 2021 = 0.8293899207476915
This year marked the most significant wave of money printing in the 107-year history of the Federal Reserve. It was triggered by the coronavirus pandemic, an epochal shift towards remote work, and negative crude oil futures prices, all of which led to a reversal in investor confidence. (see article link above).
As CoinDesk noted in its end-of-year report for 2020, “In the years leading up to the spread of COVID-19, low interest rates and the dominance of the US dollar as the world’s reserve currency allowed the US government and its corporations to build up a heavy debt burden that many observers warned could not be sustained. After the pandemic hit, the authorities responded to what one leading economist called a ‘war machine’: a Federal Reserve willing to fund trillions of dollars of US government emergency aid packages – and budget deficits.” [link]
2021: NFT and many other crypto booms
2021 was the “year of the cryptocurrency.” Events from that year make it easy to once again prove the directness of the stock markets from crypto and vice versa.
- Elon Musk’s $1.5 billion investment in February of this year – up and down at the same time:

- China’s Memorandum to Ban Bitcoin Trading and Mining in May:
Also, and importantly, non-fungible tokens (NFTs) are going mainstream, resulting huge infusions of money into crypto. At first glance, it seems that this event has nothing to do with the topic of correlation between ma. In fact, these large infusions of fiat led to the reduction of the gap between the capitalization of the stock market:
- 2020: 800 billion USD in crypto and 33388 billion USD in the stock market (at the end of the year)
- 2021: 2368 billion USD in crypto and 42368 billion USD in the stock market (at the end of the year)
growth from 2.396% to 5.589% of the cryptocurrency capitalization relative to the US stock market capitalization. And the reduction of the gap in capitalization leads to an increase in the strength of the relationship [link].
In addition, El Salvador became the first country to adopt bitcoin as a legal currency, which means that all Salvadoran companies whose shares are traded on Wall Street became dependent on bitcoin price fluctuations, as well as the general US stock market index.
Disappointing beginning of the current year
In 2022, bitcoin met 2 major crashes: one due to the crypto industry, the other due to the US economy as such.
- Due to the Terra Luna crash in May, which wiped out $500 billion in the crypto market, almost $400 billion left the market in June as the industry’s market capitalization fell below $1 trillion for the first time since January 2021. The loss of the UST peg to the dollar led to one of the biggest crypto crashes so far.
- CPI showed inflation in May at 8.6%. This terrified all markets: the Dow Jones Industrial Average fell 900 points, and the S&P 500 went into a bear market. The Nasdaq also fell 4.68% as inflation reached its highest level since 1981. Bitcoin followed them: falling from 28.000 to 17.744 USD at the moment.

It makes no sense to highlight any specific points on the chart, since they are almost identical. In 2022, the correlation of the US economy and the cryptocurrency market reached its climax:
Between the S&P 500 and Bitcoin:
- Correlation in close prices between 2022 and 2023 = 0.9048667755489098
- Correlation in volumes between 2022 and 2023 = 0.19124812034121025
- Correlation in open prices between 2022 and 2023 = 0.9060456439202328
Between NASDAQ and Bitcoin:
- Correlation in close prices between 2022 and 2023 = 0.8967791589828238
- Correlation in volumes between 2022 and 2023 = 0.29198309794024285
- Correlation in open prices between 2022 and 2023 = 0.8966962613941151
Between the United States Fed Funds Rate and Bitcoin:
- from 2022-01-01 to 2023-01-01 correlation between close price for BTC and United States Fed Funds Rate is -0.791293578736234
To sum up…
The conclusions are obvious: As a general crypto index, bitcoin depends on the US stock market as a general index of the US economy. As we’ve seen, this correlation began to emerge in 2015, when the strength of the connection was only 0.235 (average for the NASDAQ and S&P 500), then:
- 2016–2017 value is 0.79 (NASDAQ and S&P 500 average),
- 2017–2018 value is 0.84 (NASDAQ and S&P 500 average),
- 2018–2019 value is 0.04 (NASDAQ and S&P 500 average),
- 2019–2020 value is 0.54 (NASDAQ and S&P 500 average),
- 2020–2021 value is 0.80 (NASDAQ and S&P 500 average),
- 2021–2022 value is 0.28 (NASDAQ and S&P 500 average),
- 2022 value is 0.91 (NASDAQ and S&P 500 average).
The value, moving up and down but generally following an uptrend, approached 0.91 (NASDAQ and S&P 500 average) — very close to one. So, it’s hard to tell if the value will go even higher.

Considering how crypto reacted to movements in the US interest rate after 2018, we can conclude that other US macro indicators will also affect — or already affect — the decentralised market. This is bad news. Now the intervention of the authorities, in addition to direct, is moving toward indirect-economic effects. This is unlikely to lead to something good for the community.
Is that situation good? No, because the decentralised system of assets, information, and other things beloved by almost everyone has become dependent on what was originally supposed to be fought – a centralised fiat financial system. Is that a bad situation? No, because crypto started to be involved in something larger than local capital movements. It might be called “authority level-up,” where decentralised currency begins playing a new, bigger role than before. That valuable new responsibility leads to more speculation, but that’s a necessary cost.
Looking into the future and today’s trend of government intervention, we can say that these moments with speculations will be regulated as more and more businesses begin to adopt then use cryptocurrency.
Read related articles:
Disclaimer
In line with the Trust Project guidelines, please note that the information provided on this page is not intended to be and should not be interpreted as legal, tax, investment, financial, or any other form of advice. It is important to only invest what you can afford to lose and to seek independent financial advice if you have any doubts. For further information, we suggest referring to the terms and conditions as well as the help and support pages provided by the issuer or advertiser. MetaversePost is committed to accurate, unbiased reporting, but market conditions are subject to change without notice.
About The Author
Cryptomeria Capital is a crypto fund backed by blockchain industry experts. The firm believes decentralized projects, cryptocurrencies, and Web 3.0 will dramatically reshape economic relations and focuses on ventures, tokens, and projects related to blockchain technology and crypto assets. Cryptomeria Capital supports transformation by providing early-stage financing for ambitious projects in a rapidly developing industry.
More articles
Cryptomeria Capital is a crypto fund backed by blockchain industry experts. The firm believes decentralized projects, cryptocurrencies, and Web 3.0 will dramatically reshape economic relations and focuses on ventures, tokens, and projects related to blockchain technology and crypto assets. Cryptomeria Capital supports transformation by providing early-stage financing for ambitious projects in a rapidly developing industry.


