Wash-trading or coincidence: Does increased user traffic go hand in hand with high sales volume in NFT marketplaces?


In Brief
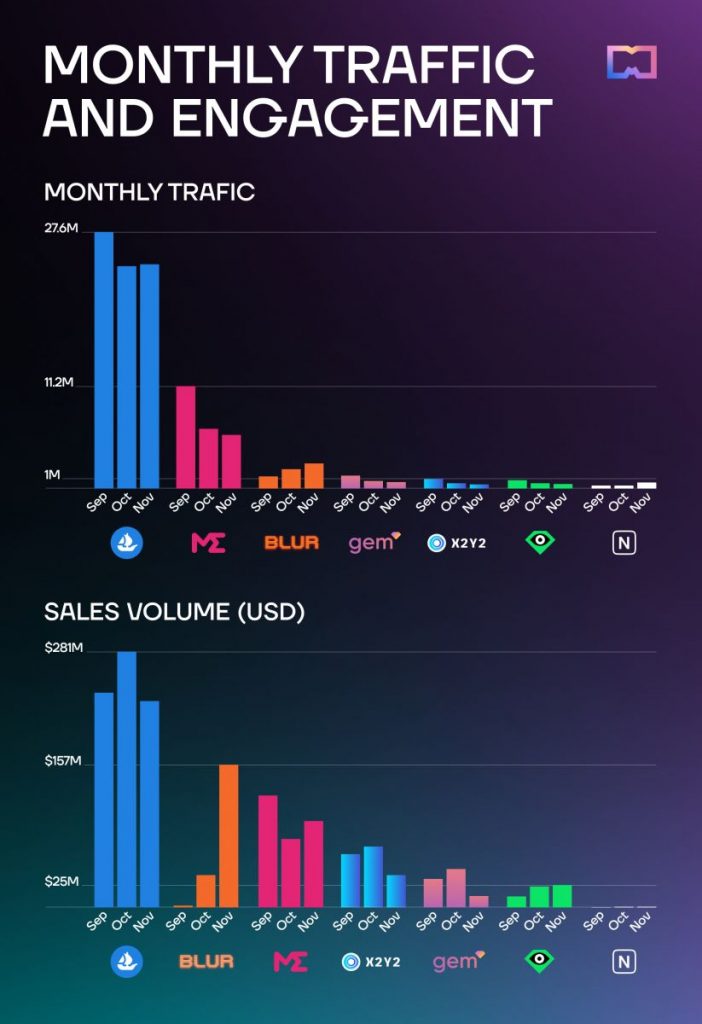
We analyzed seven NFT marketplaces to see how their website traffic reflect their sales volume.
Only Blur and Nifty Gateway had an increasing traffic and sales volume throughout the months from September to November.
Traffic and sales volume for LooksRare and X2Y2 didn’t match well.

An increase in user traffic on an NFT marketplace can potentially lead to an increase in sales. SimilarWeb, a traffic and website analysis provider, claims that “public traffic ranking reflects real-world success.” More users browsing the marketplace means more potential buyers for NFTs.
However, the interest in NFTs is sinking, along with the sales volume and active users. Not only that, but some marketplaces showed numbers that simply didn’t match, which could possibly depict fake volumes.
After analyzing seven NFT marketplaces through SimilarWeb for September, October, and November, only two had increasing traffic: Nifty Gateway and Blur. Engagement and traffic have decreased for OpenSea, LooksRare, Gem, X2Y2, and Magic Eden.
Blur and Nifty Gateway were also the only marketplaces where the monthly traffic trend matched the sales volume trend. However, there is still one undisputable winner of the NFT market, and that title goes to OpenSea. No other marketplace has managed to reach similar numbers yet.
Why did the traffic increase for some marketplaces?
From the graphs, Blur stands out the most. It is the most recent NFT marketplace and aggregator, having fully launched in October after a closed beta period in the preceding months. Blur had the most increasing monthly traffic and engagement: September showed 1.3 million visitors, October – 2.1 million, and November – 2.7 million. There are two major reasons behind the spike in activity: both the platform’s recent launch and Blur’s airdrops. In October, the marketplace announced two successful airdrops of its BLUR token.

Blur also experienced a high sales volume, $36 million in October and $157 million in November. On October 31, the platform saw a peak in trading activity due to the Art Gobblers NFT mint. Moreover, the sales volume increased steadily while the platform attracted more new users.
Nifty Gateway also saw an increase in traffic: 314K in September and 328.6K in October, then almost double in November (632.2K). However, the rapid growth in traffic doesn’t reflect the sales volume: in October, Nifty Gateway raised almost $18.8K in sales, and the figure only slightly grew in November to $20.4K. Meanwhile, Dune Analytics depicted that Nifty only had eight buyers in September and 11 traders in October and November.
At the end of September, Solana NFT marketplace Magic Eden integrated Ethereum NFTs, and in November, it added Polygon. Magic Eden expanded to other blockchains amid Solana’s crisis and the cryptocurrency’s decrease in value. Still, the NFT marketplace has one of the highest sales volumes and website traffic.
Most marketplaces had seen decreasing traffic and engagement from September until the year’s end. In some marketplaces, such as OpenSea, X2Y2, and Gem, we saw a surge in sales and users in October, mainly due to two collections: Reddit and Art Gobblers. Later, the NFT market’s downward trend continued for November and December.
Suspicions regarding LooksRare and X2Y2
Ethereum-based NFT marketplace LooksRare’s traffic decreased by 40% in a few months (from 915.6K in September to 541.8K in November). However, the sales volume didn’t mirror the trend; instead, surprisingly, it kept increasing. In September, LooksRare raised $12 million in NFT trading, followed by $23 million in October and $25 million in November. Unique users also don’t add up. In September, LooksRare had 2,365 unique users; in October, it had 3,409; and in November, the number fell back to 2,655.
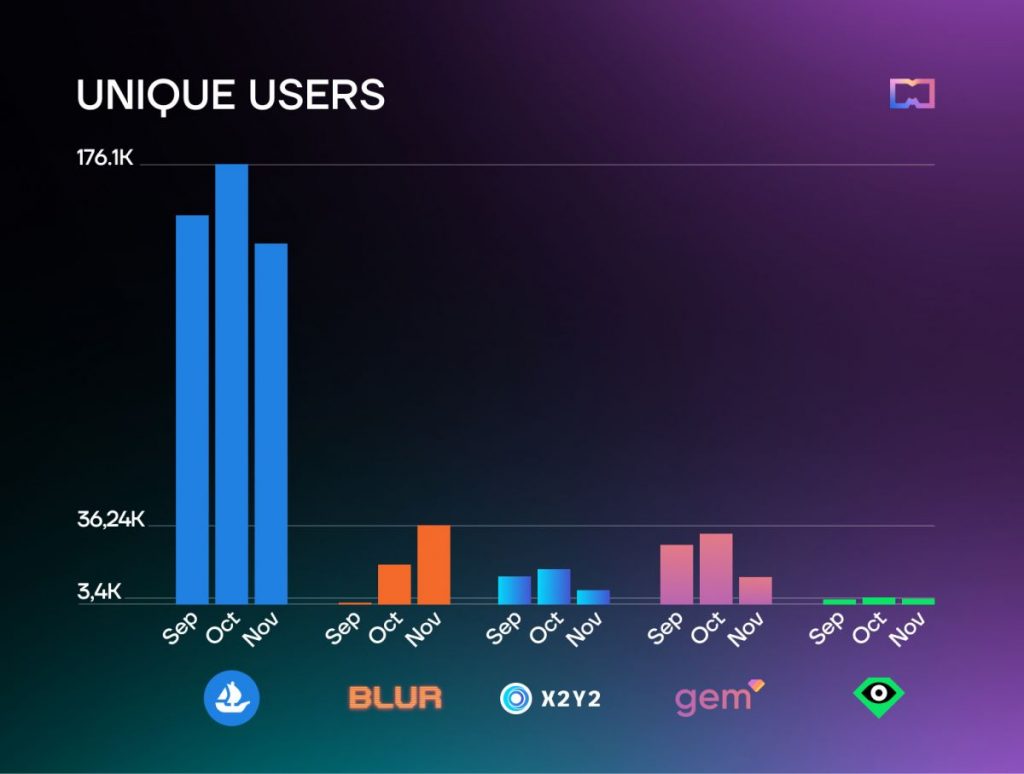
X2Y2 also raises suspicions. The data shows high sales volume ($56 million in September, $64 million in October, and $34 million in November), but the traffic remains low. Slightly less than a million users visited the website in September, and around half a million users visited in October and November. X2Y2’s monthly unique user number isn’t impressive either: 12,898 users in September, followed by 16,387 and 6,613. This raises the question of whether the sales volume hasn’t been faked.
According to another Dune Analytics board, X2Y2 frequently gets ahead of LooksRare in sales volume. Nonetheless, traffic on LooksRare is higher in October and November. Furthermore, Gem.xyz has twice as many unique users as X2Y2, but Gem’s sales volume is much lower. The monthly traffic is also higher in Gem compared to X2Y2.
Did NFTs LooksRare and X2Y2 pump due to wash-trading, fake volumes, or market manipulation? Although there have been claims that wash trades accounted for over 40% of Ethereum NFT sales volume, there is little data to confirm this phenomenon is so widespread. as a matter of fact; the opposite may be true. Cornell University students wrote in an academic paper that “wash trading may be less common than what industry observers have previously estimated.” It’s hard to know which marketplaces experience wash trading without a proper investigation by the platform or regulators.
Website traffic can be a key driver of sales volume in NFT marketplaces, but it doesn’t have to be the case, and it is not the only factor to consider. A combination of traffic, quality NFTs, marketing, and market conditions all contribute to the sales volume in NFT marketplaces. High traffic in a marketplace also doesn’t mean that all website visitors are potential buyers; the conversion rate of visitors to buyers is also an important metric to track. However, the data can help NFT collectors decide which marketplaces might be more trustworthy.
Keep track of cryptocurrency distributions in our Airdrops Calendar.
Disclaimer
In line with the Trust Project guidelines, please note that the information provided on this page is not intended to be and should not be interpreted as legal, tax, investment, financial, or any other form of advice. It is important to only invest what you can afford to lose and to seek independent financial advice if you have any doubts. For further information, we suggest referring to the terms and conditions as well as the help and support pages provided by the issuer or advertiser. MetaversePost is committed to accurate, unbiased reporting, but market conditions are subject to change without notice.
About The Author
Agne is a journalist who covers the latest trends and developments in the metaverse, AI, and Web3 industries for the Metaverse Post. Her passion for storytelling has led her to conduct numerous interviews with experts in these fields, always seeking to uncover exciting and engaging stories. Agne holds a Bachelor’s degree in literature and has an extensive background in writing about a wide range of topics including travel, art, and culture. She has also volunteered as an editor for the animal rights organization, where she helped raise awareness about animal welfare issues. Contact her on [email protected].
More articles
Agne is a journalist who covers the latest trends and developments in the metaverse, AI, and Web3 industries for the Metaverse Post. Her passion for storytelling has led her to conduct numerous interviews with experts in these fields, always seeking to uncover exciting and engaging stories. Agne holds a Bachelor’s degree in literature and has an extensive background in writing about a wide range of topics including travel, art, and culture. She has also volunteered as an editor for the animal rights organization, where she helped raise awareness about animal welfare issues. Contact her on [email protected].