Seven‑Month Peak In Fear: What Santiment’s FUD Spike Signals For Bitcoin


In Brief
Fear across crypto and equities has jumped to a seven‑month high following new U.S.–China tariff headlines. Social sentiment hit extreme negativity, while the Fear & Greed Index printed 30/100. Prior peaks of FUD have often preceded rebounds.

Market sentiment has entered its most fragile phase since March. Santiment, a blockchain‑analytics firm tracking millions of social posts, recorded a surge in negative commentary after the U.S. temporarily reintroduced 100% tariffs on Chinese goods.
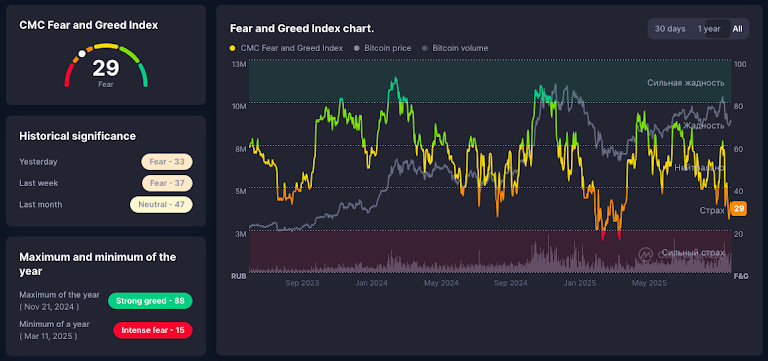
The Fear & Greed Index now shows a reading of 30, down from 40 a week ago and 48 last month. The metric reflects a shift from neutral to fear across the market and mirrors sentiment in equities, where widely followed gauges also sit in fear. The dual decline marks a rare moment of emotional parity between crypto and Wall Street.
Retail Sentiment and the Power of Overreaction
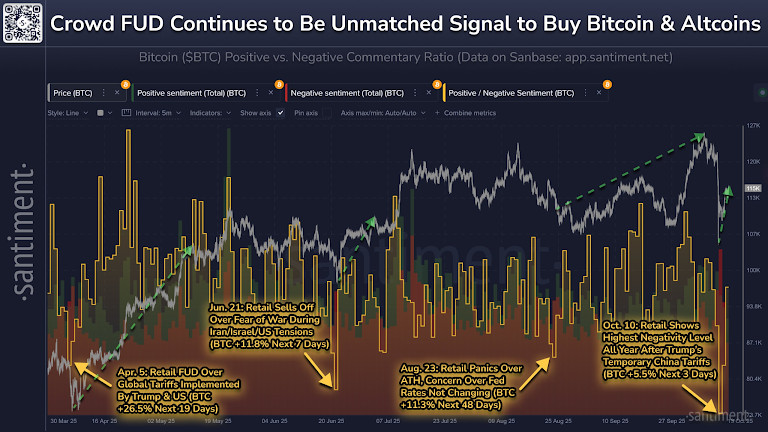
Santiment’s seven‑month series isolates four episodes where crowd pessimism peaked and prices subsequently recovered:
April 5. Retail fear over global tariffs intensified across social feeds. Bitcoin gained 26.5% over the next 19 days.
June 21. Escalating headlines around Iran, Israel, and the U.S. drove a short, sentiment‑led selloff. Bitcoin advanced 11.8% in the following 7 days.
August 23. Anxiety around a perceived lack of Fed easing pushed negativity to fresh highs. Bitcoin rose 11.3% across the next 48 days.
October 10. Temporary 100% tariffs on China produced the year’s strongest retail negativity. Bitcoin climbed 5.5% within 3 days.
The pattern is consistent: shock, capitulation, then recovery once negative commentary exhausts.
The October sentiment reversal occurred against a backdrop of trade‑policy tension and monetary uncertainty. The White House’s decision to maintain portions of Trump‑era tariffs reignited discussions about supply‑chain fragility, while the Federal Reserve’s neutral communication frustrated expectations for rate adjustments. Binance Square summarized this period as a “tug‑of‑war between macro resilience and delayed relief.” Its analysis noted two parallel outcomes:
- Capital rotation: liquidity moved toward defensive instruments, echoing pre‑decision risk aversion seen earlier in the year.
- Divergence in behavior: retail traders amplified pessimistic narratives, while on‑chain data from Santiment indicated accumulation by larger wallets.
This polarity between visible panic and silent positioning defines the present cycle.
Record Liquidations Amid Cross‑Market Fear
Ash Crypto, a market analyst and on‑chain commentator, reported a rare alignment between traditional and digital risk sentiment — Stocks 30 (Fear) and Crypto 38 (Fear) — accompanied by what he described as the largest liquidation event in the history of crypto markets. His data showed $19.16 billion in total liquidations over 24 hours, with $16.70 billion in long positions and $2.46 billion in shorts wiped out.
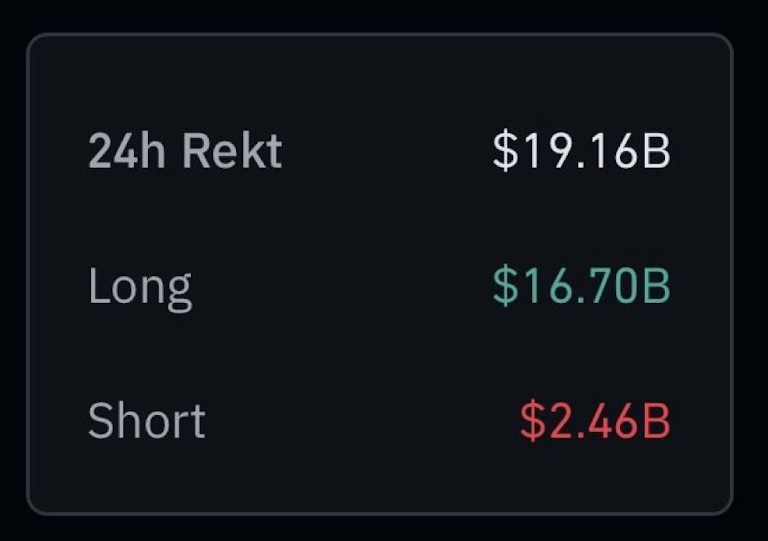
The scale dwarfed previous stress points, including the March 2020 Covid crash ($1.2 billion) and the 2022 FTX collapse ($1.6 billion). Such synchronized fear and forced deleveraging typically mark the exhaustion of leveraged positions rather than the start of new declines. In prior drawdowns mapped by Santiment, comparable liquidation surges were followed by volatility compression and gradual price normalization.
The Fear & Greed Index: Reading the Current Signal
The Fear & Greed Index aggregates volatility, volume, momentum, and dominance into a single indicator. Its 30‑point “Fear” reading mirrors sentiment seen in the equity market’s own fear gauge. Historical data on the platform show that levels below 40 often align with mid‑cycle accumulation. Yesterday’s index registered 33 (Fear), last week’s 37 (Neutral), and last month’s 47 (Neutral), highlighting the velocity of sentiment change.
João Wedson, Founder & CEO of Alphractal, extended this sentiment analysis to macro stress signals in his post. His research integrates several high‑frequency datasets that, when viewed together, create a progressive narrative of underlying market tension.
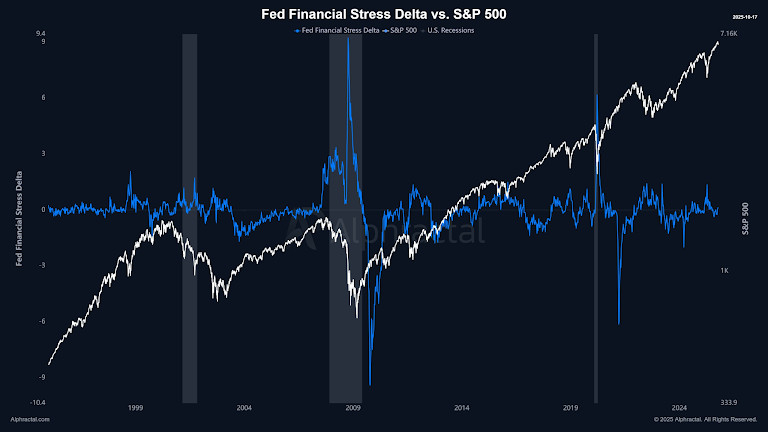
He begins with the Fed Financial Stress Delta, showing how the year‑over‑year change in the Federal Reserve’s Financial Stress Index captures the buildup of hidden pressure. Every surge in this blue line historically coincided with periods where liquidity tightened and credit spreads widened — moments that preceded volatility before it appeared in price charts.
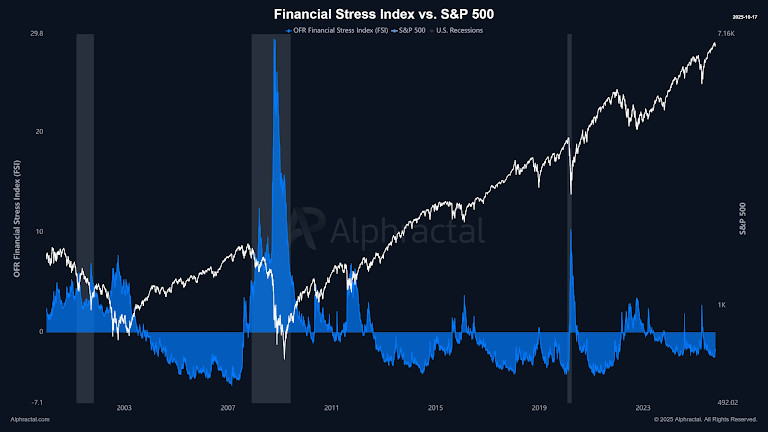
Next comes the OFR Financial Stress Index, an aggregated tension gauge built on 18 financial indicators, from funding costs to rate spreads. Spikes above zero highlight systemic stress that tends to surface months before major equity drawdowns. In past cycles, each peak in the FSI aligned with later phases of macro uncertainty.
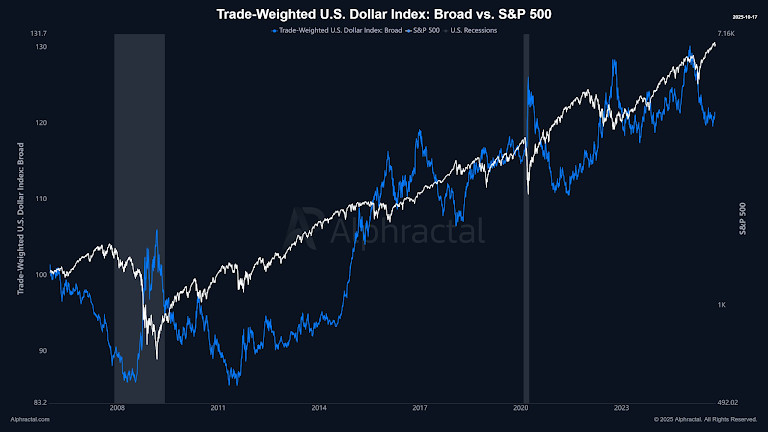
He then turns to the Trade‑Weighted U.S. Dollar Index, illustrating how a strengthening dollar suppresses global liquidity and pressures risk assets. The correlation with equity pullbacks is evident: as the dollar climbs, liquidity drains from peripheral markets — including crypto — forcing risk repricing across assets.
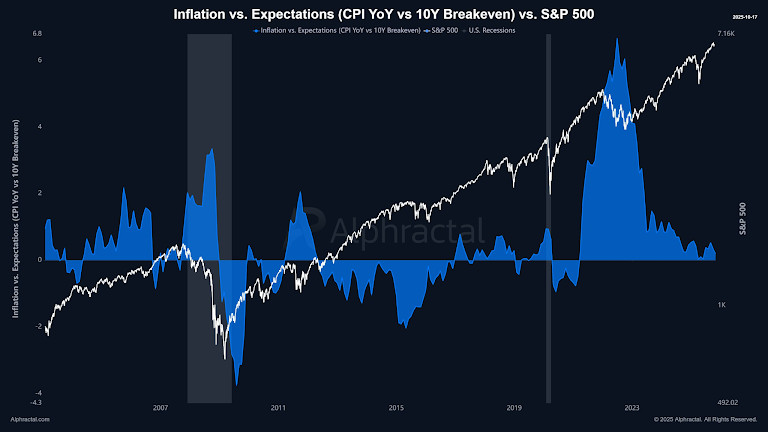
Finally, the Inflation vs. Expectations comparison (CPI YoY against 10‑year breakeven) tracks how real inflation diverges from anticipated levels. When inflation repeatedly overshoots expectations, policy tightening accelerates and risk sentiment weakens. The chart captures that divergence, which Wedson interprets as an early warning signal — not of collapse, but of compression.
Across all charts, the theme is consistent: early macro stress builds quietly before visible drawdowns. Wedson concludes that while none of the indicators have entered danger zones, subtle liquidity strain and expectation misalignments are emerging. According to his Alphractal Labs analysis, such transitions typically appear 12–18 months before bear‑market formations — signaling preparation, not panic.
Preparing the Next Phase: Liquidity, Stress and the Quiet Set-Up
Markets are sending signals well ahead of a breakdown. Several independent datasets now align in one direction: quietly rising stress, squeezed liquidity and modest growth deceleration. For example, the Organisation for Economic Co‑operation and Development projects U.S. growth around 1.8 % in 2025, with further deceleration expected into 2026. Meanwhile, analysts at Alphractal highlight early inflection points: stress deltas climbing, dollar strength constraining global liquidity, inflation trending above expectations. His visual models show these conditions historically precede—not follow—larger market rotations.
In short: the present wave of fear may not mark a breakdown but rather a structural inflection. Trading volume flushed, retail sentiment capitulated, leverage diminished. The next phase is less about emotion and more about positioning. Whether momentum pivots toward relief or remains stuck in consolidation will depend on how policy, credit spreads and dollar dynamics evolve.
The Post-Fear Phase: Shifting Liquidity and Early Calm
The fear phase has cooled into equilibrium. The CMC Crypto Fear & Greed Index reads 42 (Neutral), up from 33 a week earlier — a decisive shift from anxiety to balance. Total crypto market capitalization stands near $3.86 trillion, with daily volume of $146 billion. Bitcoin trades at $114,505, Ethereum at $4,113, BNB at $1,135, Solana around $200, and XRP at $2.65.
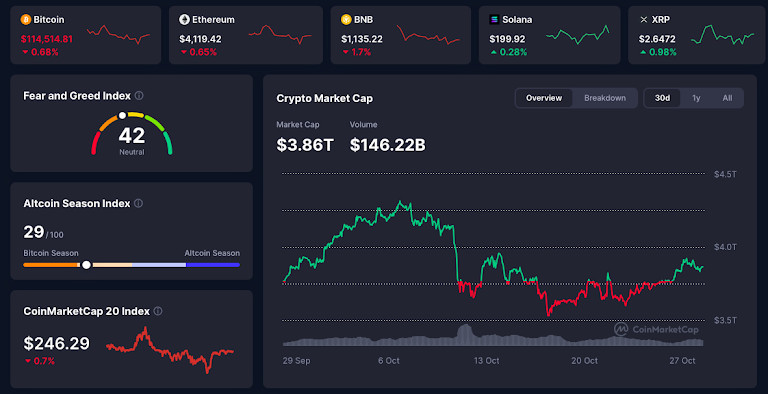
This recovery follows one of the year’s deepest liquidation waves. Sentiment metrics and trading data show a gradual rebuild: open interest in BTC futures has risen roughly 12 % from mid-October lows, and retail commentary has normalized. Yet risk appetite remains cautious — the Altcoin Season Index 29/100 confirms that capital still favors Bitcoin-dominant exposure.
Cycle indicators suggest structural health rather than overheating. The Puell Multiple (1.14) places Bitcoin in an undervalued range, implying miner revenues have stabilized below speculative extremes. The Pi Cycle Top Status shows no crossover between the 111-day MA (~ $114.8K) and 350DMA×2 (~ $204.4K), underscoring that the market is mid-cycle, not euphoric.
On-chain signals align with that view. According to Alphractal on X:
Bitcoin has broken above the Short-Term Holder Realized Price and the True Market Mean Price, levels that historically precede accumulation phases. Their models depict BTC reclaiming its mid-cycle valuation band for the first time since August — a quietly bullish turn as large holders resume positioning while retail remains hesitant.
Macro conditions echo this moderation. The VIX has eased from 26 to 20, liquidity stress has stabilized, and correlations between equities and crypto have softened. With sentiment neutral, volatility compressed, and structural metrics supportive, the market stands in a controlled reset — not fearful, not greedy, but quietly rebuilding its base.
Disclaimer
In line with the Trust Project guidelines, please note that the information provided on this page is not intended to be and should not be interpreted as legal, tax, investment, financial, or any other form of advice. It is important to only invest what you can afford to lose and to seek independent financial advice if you have any doubts. For further information, we suggest referring to the terms and conditions as well as the help and support pages provided by the issuer or advertiser. MetaversePost is committed to accurate, unbiased reporting, but market conditions are subject to change without notice.
About The Author
Alisa, a dedicated journalist at the MPost, specializes in cryptocurrency, zero-knowledge proofs, investments, and the expansive realm of Web3. With a keen eye for emerging trends and technologies, she delivers comprehensive coverage to inform and engage readers in the ever-evolving landscape of digital finance.
More articles

Alisa, a dedicated journalist at the MPost, specializes in cryptocurrency, zero-knowledge proofs, investments, and the expansive realm of Web3. With a keen eye for emerging trends and technologies, she delivers comprehensive coverage to inform and engage readers in the ever-evolving landscape of digital finance.


