Accumulation/Distribution Indicator


What is Accumulation/Distribution Indicator?
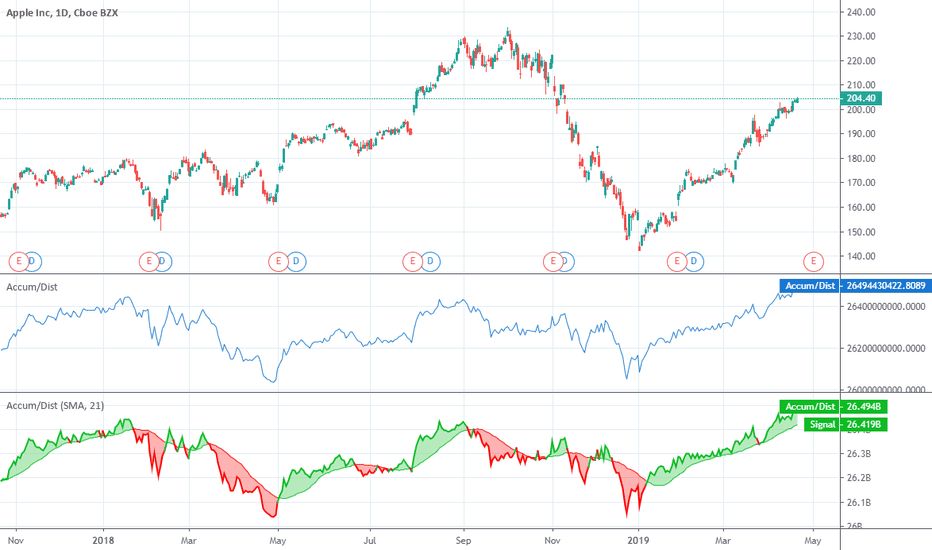
The proximity of a closing price to its high and low price determines whether more traders are purchasing (accumulating) or selling a certain security.
The accumulation/distribution (A/D) indicator (also known as the Accumulation Distribution Line or ADL) is a technical indicator that measures the underlying supply and demand for an asset using volume.
Understanding Accumulation/Distribution Indicator
By monitoring the A/D indicator, investors may observe if an asset is being bought (accumulated) or sold (distributed). This is noteworthy since the ADL can provide a total of a period’s Money Flow Volume, allowing investors to follow the money to see how divergences between volume and price can either confirm a current trend or be an early indicator of a change in direction.
The A/D indication is a cumulative indicator, similar to the On-Balance Volume (OBV). The OBV indicator adds all of the volume on up days and subtracts all of the volume on down days. If a security closes higher than it did the previous day, the entire volume is considered up-volume. Similarly, when a security closes lower than the previous day’s close, the entire volume is regarded as down volume. This exemplifies both the indicator’s simplicity and its shortcoming.
Read related articles:

Disclaimer
In line with the Trust Project guidelines, please note that the information provided on this page is not intended to be and should not be interpreted as legal, tax, investment, financial, or any other form of advice. It is important to only invest what you can afford to lose and to seek independent financial advice if you have any doubts. For further information, we suggest referring to the terms and conditions as well as the help and support pages provided by the issuer or advertiser. MetaversePost is committed to accurate, unbiased reporting, but market conditions are subject to change without notice.
About The Author
Damir is the team leader, product manager, and editor at Metaverse Post, covering topics such as AI/ML, AGI, LLMs, Metaverse, and Web3-related fields. His articles attract a massive audience of over a million users every month. He appears to be an expert with 10 years of experience in SEO and digital marketing. Damir has been mentioned in Mashable, Wired, Cointelegraph, The New Yorker, Inside.com, Entrepreneur, BeInCrypto, and other publications. He travels between the UAE, Turkey, Russia, and the CIS as a digital nomad. Damir earned a bachelor's degree in physics, which he believes has given him the critical thinking skills needed to be successful in the ever-changing landscape of the internet.
More articles
Damir is the team leader, product manager, and editor at Metaverse Post, covering topics such as AI/ML, AGI, LLMs, Metaverse, and Web3-related fields. His articles attract a massive audience of over a million users every month. He appears to be an expert with 10 years of experience in SEO and digital marketing. Damir has been mentioned in Mashable, Wired, Cointelegraph, The New Yorker, Inside.com, Entrepreneur, BeInCrypto, and other publications. He travels between the UAE, Turkey, Russia, and the CIS as a digital nomad. Damir earned a bachelor's degree in physics, which he believes has given him the critical thinking skills needed to be successful in the ever-changing landscape of the internet.