Crypto Weekly Recap: Bitcoin Breaks $100K, Ethereum Reclaims $4K, Toncoin Had a Slow Week


In Brief
Bitcoin surged past $100K, Ethereum reclaimed $4K, while Toncoin had a quiet week despite institutional backing and adoption updates.

Bitcoin News & Macro
As you’d expect, Bitcoin absolutely dominated the spotlight this week, smashing past the long-anticipated $100,000 barrier. The surge was fueled by heavy institutional buy-in. The runaway success of Bitcoin ETFs like BlackRock’s iShares Bitcoin Trust, has propelled confidence to new highs. BlackRock’s trust alone now controls over 500,000 BTC, valued at $48 billion — a testament to institutional faith in Bitcoin.
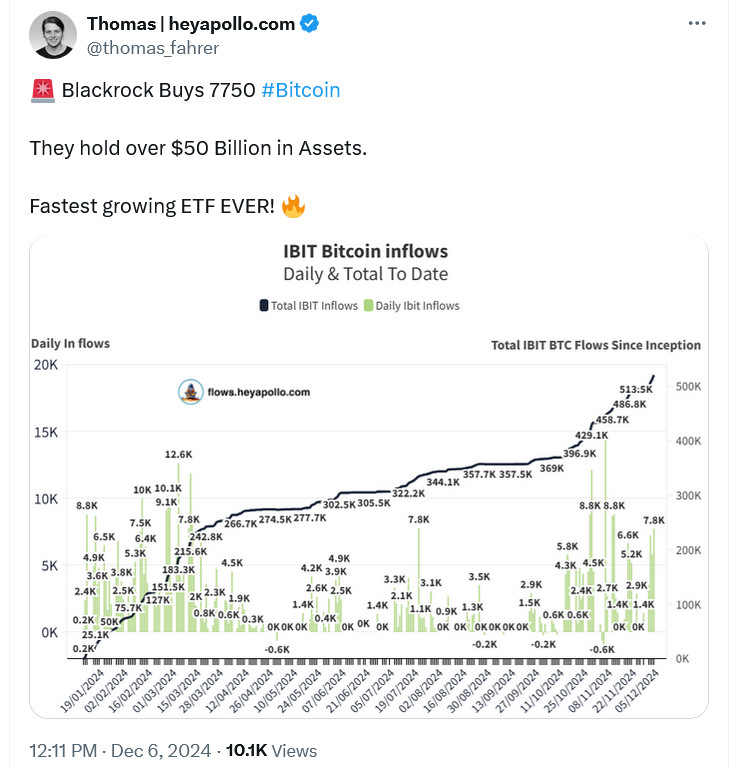
Source: Thomas Fahrer
However, the climb wasn’t without its drama. A flash crash briefly sent BTC tumbling to $93,000, wiping out $303 million in long positions in minutes. But Bitcoin proved its mettle, snapping back to the $100,000 range. Analysts see this consolidation as a pause before the next leg up, with targets of $115,000 looming as liquidity continues to flood in.

Bitcoin was trading at $96,410 at the time of publication. Source: TradingView
MicroStrategy doubled down on its Bitcoin bet, scooping up $1.5 billion worth of BTC in a single week.
MicroStrategy remains the largest corporate Bitcoin holder. Source: BitcoinTreasuries
This aggressive move underscores the growing trend of corporations using Bitcoin as a strategic asset to shield against inflation and currency risks. Such bold acquisitions ripple through the market, stoking optimism and drawing fresh participants, both institutional and retail.
Also, you may have heard of South Korea’s fleeting martial law, which triggered a sharp selloff in the BTC/KRW pair. So Bitcoin’s still sensitive to geopolitical shocks.
BTC/KRW activity on South Korea-based crypto exchange Upbit. Source: Upbit
Meanwhile, El Salvador’s BTC stash soared, with unrealized gains topping $300 million. Sure enough, this is a powerful validation of its Bitcoin-first monetary policy. Whispers have been stirred of other nations considering similar moves.
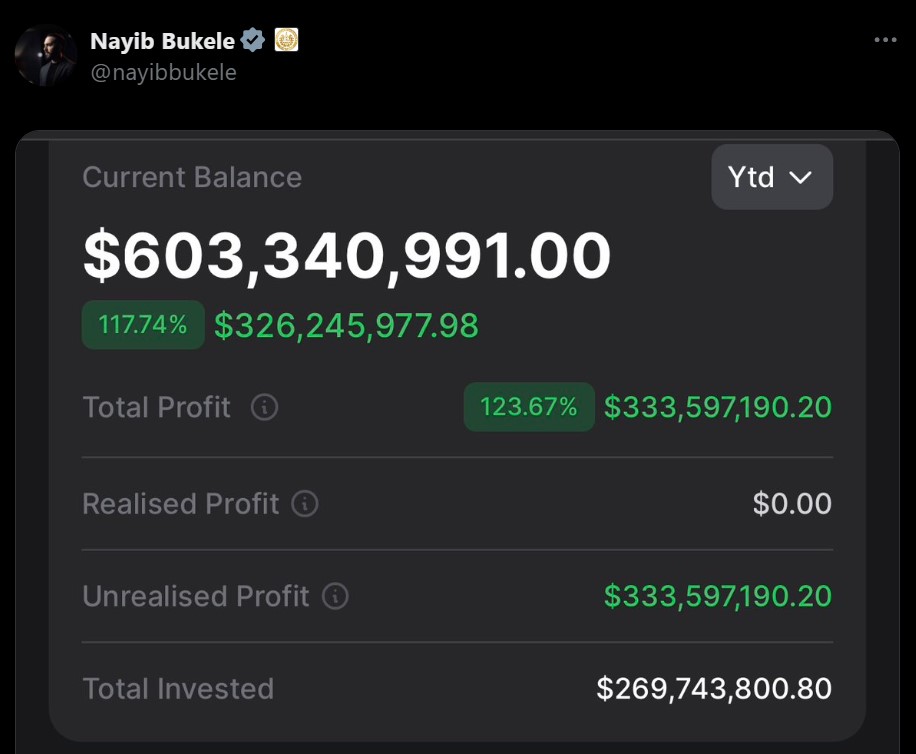
Source: Nayib Bukele
The broader picture shows Bitcoin tightening its grip on the market. With dominance climbing to 57%, altcoins are taking a backseat, and futures markets are buzzing with bullish bets.
BTC Price Analysis
On the technical front, BTC spent the week teasing traders with a flirtation around the (once) legendary $100K milestone.
BTC/USD 1D Chart, Coinbase. Source: TradingView
The initial breakout above $100K looked promising, with a push to $102K, but the rally fizzled fast. Sellers stepped in hard, driving the price back to $97K, where buyers made their stand. This pullback wasn’t just technical; it felt like the market testing whether the bulls had the resolve to defend their ground.
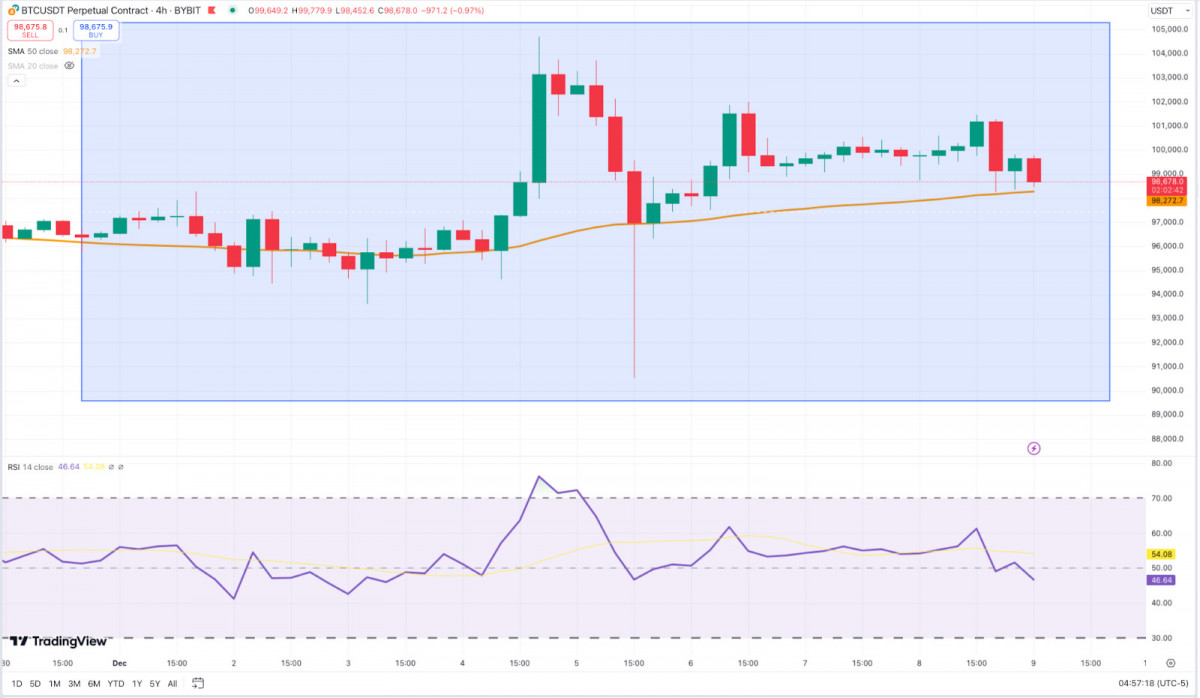
BTC/USD 4H Chart, Coinbase. Source: TradingView
Zooming into the 4-hour chart, BTC has been stuck in a tight squeeze, bouncing between $97K support and $100K resistance. The failed push above $100K gave way to a textbook bear flag, hinting at a potential breakdown if momentum fades further. Still, buyers have defended the 50-EMA on intraday moves, showing there’s life left in this range. A decisive breakout above $100K would open the floodgates for a rally toward $105K, while losing $97K could trigger a slide to $95K or worse. Either way, this isn’t just another range – it’s a battleground.
Ethereum News & Macro
Ethereum also got a piece of the spotlight, reclaiming the $4,000 mark for the first time since March. Institutional investors are piling in as Ether ETFs are seeing a jaw-dropping $1.3 billion in inflows over two weeks.
Source: Anthony Sassano
BlackRock’s $500 million boost to its ETH ETF holdings is a clear signal that Ethereum isn’t just riding Bitcoin’s coattails — it’s carving out its own path as BTC cruises past $100,000.
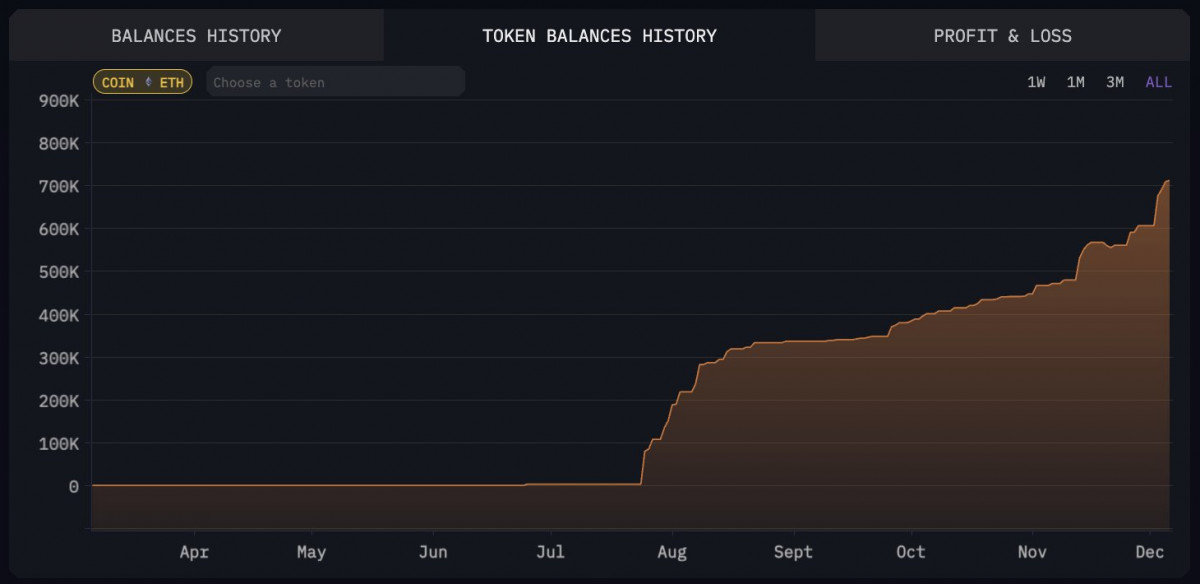
Blackrock ETH ETF holdings. Source: Arkham Intelligence
The climb past the $4,000 resistance is not a mere a psychological win – it’s setting the stage for Ether to push into uncharted territory.
Ethereum’s strength relative to Bitcoin is also turning heads. After months of lagging, the ETH/BTC pair is showing signs of life. Experts are calling for a solid rebound in the months ahead. This resurgence is backed by Ethereum’s fundamentals, including the Beacon Chain’s growing reliability and a steady stream of advancements in layer-2 scaling.

The ETH/BTC ratio is up 9.14% over the past 30 days. Source: TradingView
Beyond price action, Ethereum’s dominance in DeFi and NFTs remains rock-solid. Weekly NFT sales topped $187 million, further showcasing the network’s unparalleled versatility.
Top NFT collections by seven-day sales volumes. Source: CryptoSlam
With trading volumes hitting fresh highs and Ethereum’s ecosystem expanding, it’s clear that Ether is far from done making big moves.
ETH Price Analysis
Speaking of moves, Ethereum’s battle around the $4,000 milestone has pretty much defined the past week. On the daily chart, a rally pushed the price above this psychological level, breaking out from weeks of consolidation.
ETH/USD 1D Chart, Coinbase. Source: TradingView
But the failure to sustain closes above $4,000 signaled a shift — rejection candles and rising sell pressure hinted at fading bullish momentum. The 20-EMA acted as support during the climb but is now under pressure. While the broader uptrend remains intact above the 50-EMA, the decisive close below $4,000 has flipped it into resistance, raising questions about short-term strength.
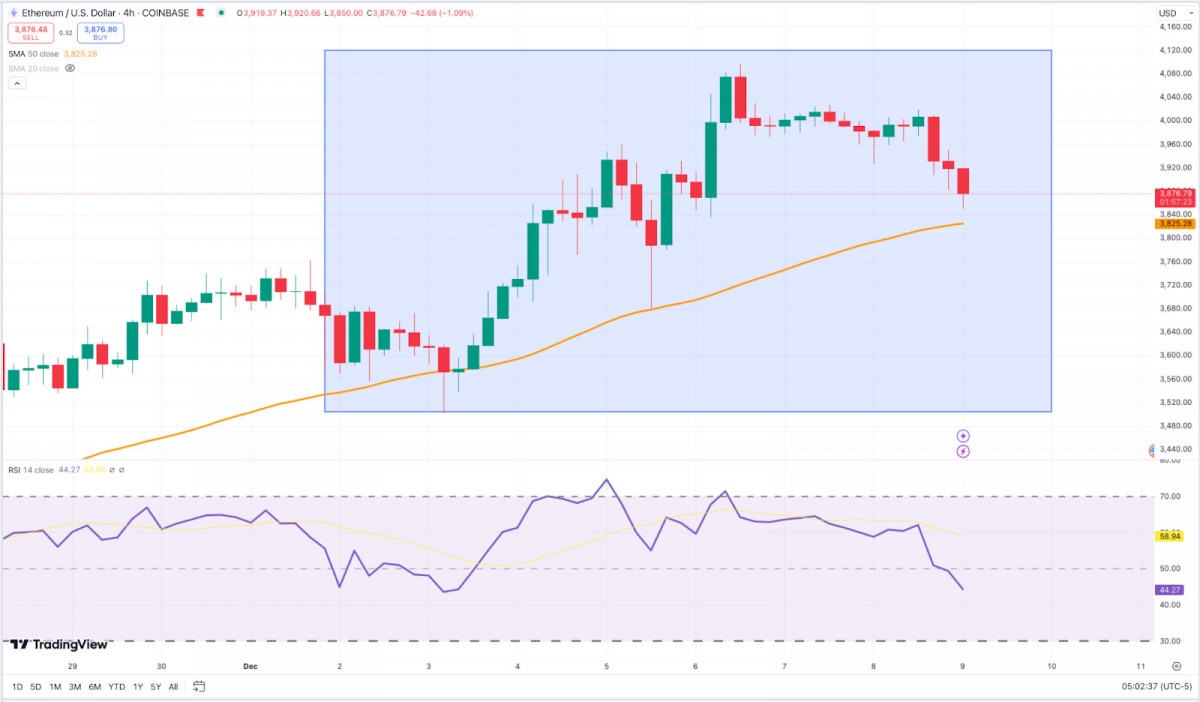
ETH/USD 4H Chart, Coinbase. Source: TradingView
On the 4-hour chart, a false breakout at $4,100 triggered a sharp selloff, with the 50-EMA catching the dip as temporary support. A descending triangle near $4,000 broke down, intensifying the move lower. The RSI mirrored this shift, sliding toward oversold territory and reinforcing bearish momentum. Support around $3,840, tied to prior daily lows, has stabilized price action for now, suggesting possible accumulation. If bulls can reclaim $4,000 with conviction, it could set the stage for another test of $4,100. For now, the market appears caught in a tug-of-war, reassessing its conviction at this key level.
Toncoin News & Macro
It’s been a slow week for TON Coin, with relatively few major developments. On December 3, Pantera Capital dropped news of a record investment into the TON ecosystem, along with an extra $20 million raised for further blockchain initiatives.
Source: Panteracapital.com
While this signals serious institutional backing, the market barely flinched, likely reflecting a
broader cool-off in crypto sentiment.
A couple of days later, P2P.org announced its expansion into TON staking, letting users stake as little as one TON with no pool limits.
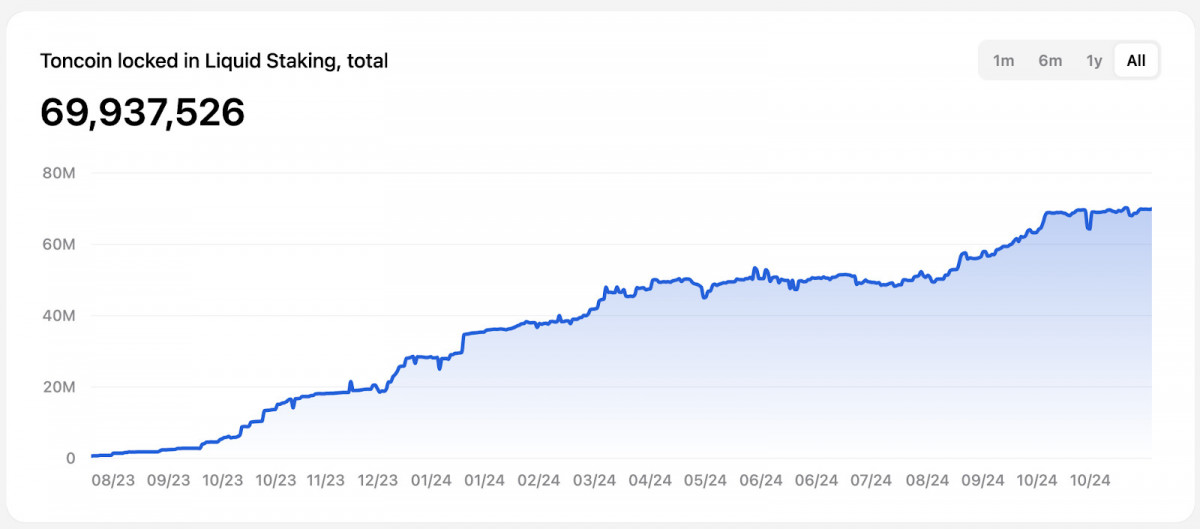
TON tokens locked in liquid staking protocols. Source: Tonstat
The move makes staking more accessible, boosting TON’s usability. But again, the market response was underwhelming, showing that even adoption-focused updates couldn’t stir much action this week.
Meanwhile, Telegram founder Pavel Durov testified in a French court on December 6 following his recent arrest. While the case isn’t directly tied to TON, Durov’s connection to the blockchain keeps these legal moves on the radar for TON watchers. His remarks — expressing faith in the French legal system while staying mum on the allegations — did little to impact the coin.

Pavel Durov and his lawyer David-Olivier Kaminski arrive at the Paris judicial court on December 6, 2024. © Thomas SAMSON / AFP
So yeah, it’s been a quiet stretch for TON. But who knows – maybe it’s the calm before the storm?
TON Price Analysis
On the 1D chart, Toncoin (TON) started the week with a sharp rally, breaking above $6.60 resistance and pushing toward $7, fueled by strong bullish momentum. The 20-day EMA supported the move, staying well above the 50-day EMA — a classic sign of sustained upward pressure.
TON/USD 1D Chart. Source: TradingView
But as the price approached the $7 psychological barrier, momentum faded. A clear rejection sparked a decisive sell-off, breaking support at $6.70 and ending the week near $6.50 — a bearish signal heading into next week. The $6.30 level, a prior pivot zone from late November, now stands as a critical support, while $6.80 flips into immediate resistance.
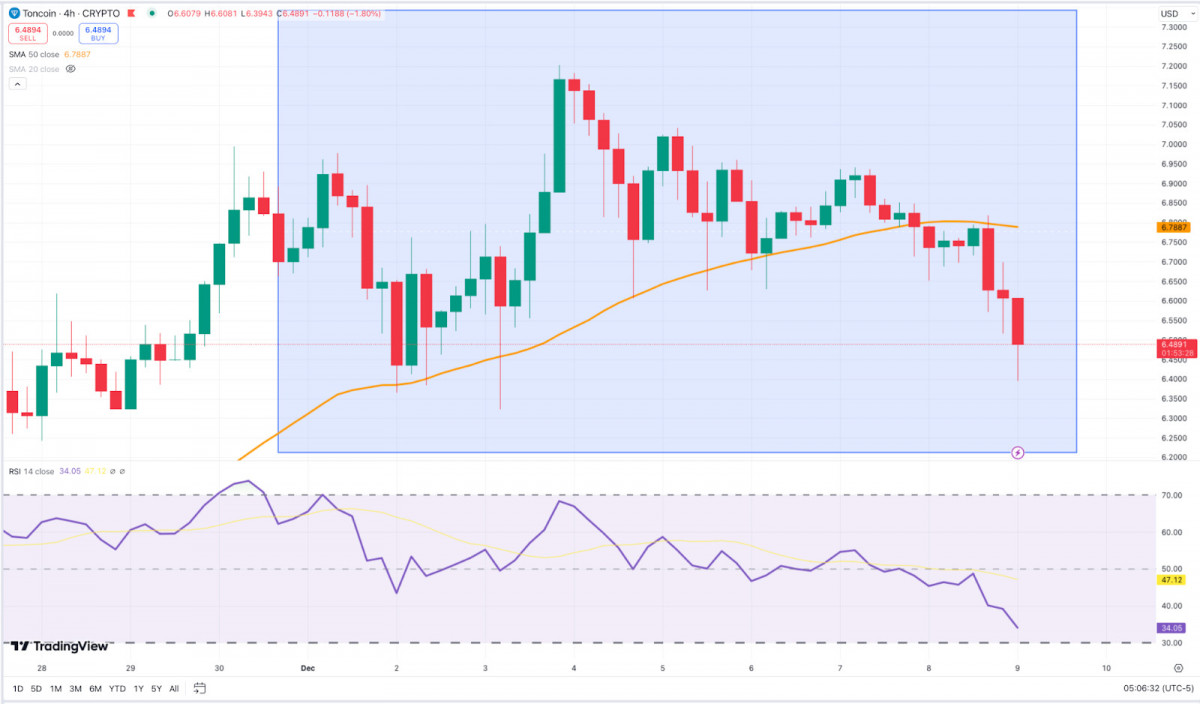
TON/USD 4H Chart. Source: TradingView
The 4H chart shows the rally stalling into a rising wedge — a bearish setup that delivered on its breakdown. The rejection at $6.80 led to an accelerated drop, with the 50-EMA on this timeframe flipping from support to resistance. RSI confirmed the shift, sliding from overbought into oversold as selling pressure intensified. Key weekly levels — $6.50 and $6.30 — are now pivotal. If $6.30 gives way, the next stop could be $6.00, a major demand zone. Bulls will need to reclaim $6.80 to regain control, but the tone for now is firmly bearish.
Disclaimer
In line with the Trust Project guidelines, please note that the information provided on this page is not intended to be and should not be interpreted as legal, tax, investment, financial, or any other form of advice. It is important to only invest what you can afford to lose and to seek independent financial advice if you have any doubts. For further information, we suggest referring to the terms and conditions as well as the help and support pages provided by the issuer or advertiser. MetaversePost is committed to accurate, unbiased reporting, but market conditions are subject to change without notice.
About The Author
Victoria is a writer on a variety of technology topics including Web3.0, AI and cryptocurrencies. Her extensive experience allows her to write insightful articles for the wider audience.
More articles

Victoria is a writer on a variety of technology topics including Web3.0, AI and cryptocurrencies. Her extensive experience allows her to write insightful articles for the wider audience.


