Web3 On-Chain Data Insights: In April, Solana Tops Activity, Ethereum Sees Capital Inflows, Bitcoin Shows Structural Rebound


In Brief
Cryptocurrency exchange Gate.io released a report, providing a summary of Web3 on-chain activity in April 2025.

Cryptocurrency exchange Gate.io released a report, providing a summary of Web3 on-chain activity in April 2025. Solana maintained an average of over 93 million daily transactions, reaching a cumulative total of 2.4 billion by April 26, continuing to lead all blockchains in usage. Among capital flow data across major chains, Ethereum recorded a net inflow of over $904 million, ranking first across the network. On the Bitcoin network, wallet addresses holding more than 10,000 BTC showed cumulative scores between 0.9 and 1, indicating near-complete net accumulation. Additionally, Bitcoin’s UTXO net growth remained positive, reflecting a gradual recovery in network activity. As of April 28, Raydium’s LaunchLab had created 25,207 tokens, with a graduation rate of approximately 0.84%. Meanwhile, the meme token $TRUMP triggered a wave of market enthusiasm, surging over 50% in price following the announcement of an exclusive golf dinner and White House tour event, leading to a notable increase in both token holders and on-chain activity.
On-Chain Data Overview
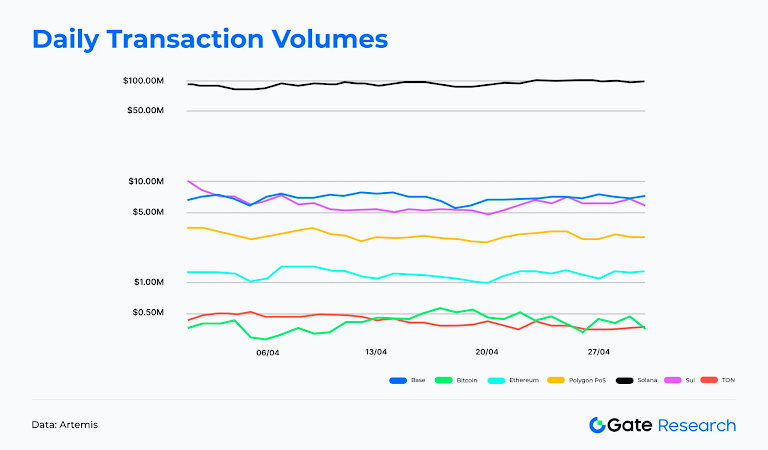
In April, Solana dominated all blockchains, averaging over 93 million daily transactions and reaching 2.8 billion cumulative transactions by April 30. Base and Sui indicate strong activity, as they recorded stable daily volumes of 7 million and 6.1 million, respectively. Polygon PoS and Ethereum maintained steady trends, posting over 2.9 million and 1 million daily transactions, respectively. TON and Bitcoin remained lower, fluctuating between 200k–400k transactions per day.
While Solana held the top position, emerging chains like Base and Sui, though smaller in scale, demonstrated high interaction and strong ecosystem momentum. Base benefited from the Coinbase ecosystem and meme coin activity, maintaining over 7 million daily transactions and briefly reaching $350k in daily gas revenue mid-April. This highlights its commercialisation potential. Sui sustained high engagement, averaging 6.1 million daily transactions, driven by gaming, NFTs, and its Move-based developer ecosystem. Both chains are rapidly expanding in low-fee, high-interaction environments, emerging as leading next-generation Layer 1s.
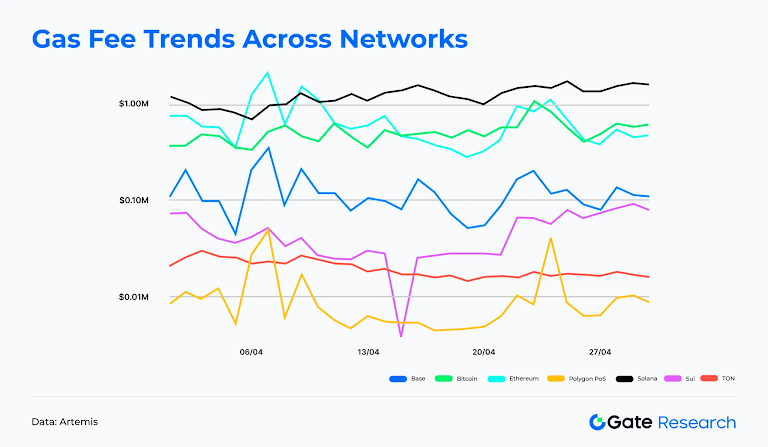
Solana dominated gas revenue in April with an average of $1.2 million per day, totaling $37.5 million by month-end. Bitcoin and Ethereum followed, each earning about $500,000–700,000 per day. Base saw a strong mid-month peak of nearly $350,000. Sui, Polygon PoS, and TON remained below $50k in daily fees, staying at low levels. Overall, major chains continue to lead in fee income, while emerging chains like Base are gradually showing commercial potential.
In April, Solana consistently processed an average of 93 million daily transactions while maintaining over 4 million daily active addresses, with a monthly average of approximately 4.5 million. This underscores that the network’s activity is not merely driven by bots or isolated protocols but is supported by a robust and diverse user base. On April 11, active addresses peaked at over 6.2 million, further emphasising a significant spike in ecosystem engagement.
Furthermore, Solana generated an average of over $1.2 million in daily gas fees, far exceeding most other blockchains. This reflects that the network’s high transaction volume is not only frequent but also supported by genuine fee generation, rather than artificial transaction inflation. This trend is closely tied to MEV reward mechanisms, such as Jito, which incentivise high-frequency traders and arbitrage bots, driving up transaction fees. Platforms like Pump.fun continue to attract meme coin creators, while aggregators like Jupiter facilitate high-volume swap transactions, sustaining elevated levels of on-chain interaction.
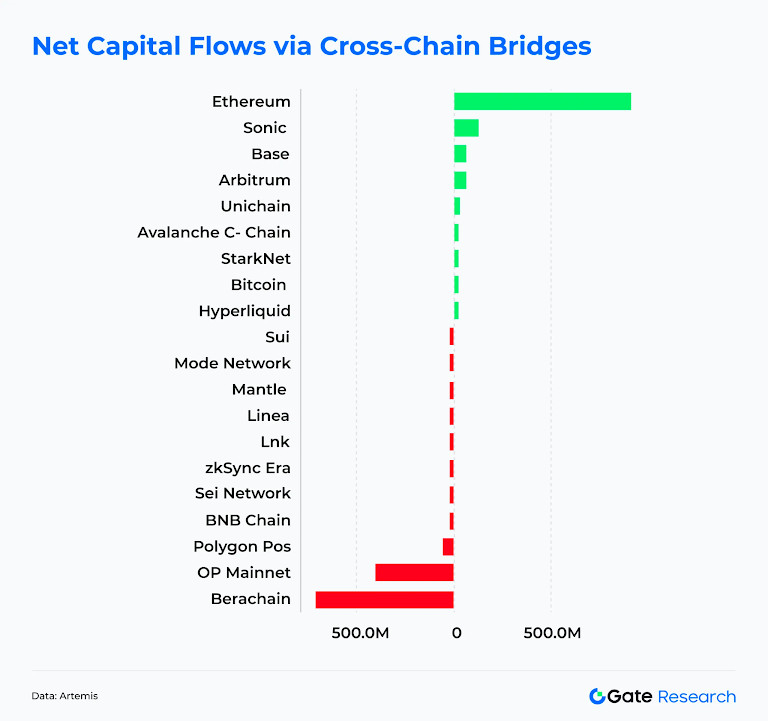
As of April 28, Ethereum recorded over $904 million in net inflows, ranking first among all blockchains and reversing three consecutive months of capital outflows. This return of capital reaffirmed Ethereum’s role as the primary “store of value” chain. The inflow trend likely reflects improving market risk appetite, stabilization of Layer 2 activities, and growing ETF optimism, all of which attracted long-term capital back to the mainnet.
Among emerging blockchains, Sonic stood out by attracting over $124 million in net inflows in April, climbing to second place. This reflects growing market recognition of Sonic’s high-performance architecture and low transaction costs, which have drawn new capital into its ecosystem. Base and Arbitrum recorded approximately $64.8 million and $62.1 million in net inflows, respectively, showing continued positive flows into certain L2 networks supported by stable developer activity and user growth. Smaller ecosystems like Sui and Hyperliquid maintained modest net inflows, indicating continued capital attraction in vertical segments such as trading and gaming.
Conversely, Berachain experienced the largest net outflow of any chain, totaling $704 million. OP Mainnet and Polygon PoS also saw net outflows of $400 million and $57 million, respectively, suggesting short-term capital rotation to other blockchains or off-chain markets. Overall, April marked a structural recovery in capital flows—Ethereum reclaimed dominance, Sonic emerged as a strong contender, while some early hot projects faced renewed redistribution pressures, signalling a subtle shift in the competitive landscape of public blockchains.
The following section selects and analyzes several key Bitcoin indicators to summarise market trends.
According to Glassnode data, during the recent Bitcoin price rebound, large holders have clearly shown a continuous buying pattern:
- Wallet addresses holding more than 10,000 BTC have cumulative scores between 0.9 and 1, indicating they are almost entirely in net buying mode.
- Addresses holding between 1,000 and 10,000 BTC have scores between 0.7 and 0.8, showing that this group is actively accumulating.
- Mid-sized holders with 10 to 1,000 BTC have seen their scores rise to around 0.5, indicating a shift from neutral to slightly buying.
This suggests that during Bitcoin’s rebound after the mid-April correction, large funds (whales) have re-entered the market first and are consistently accumulating, helping to restore market confidence. These entities often have significant influence on price trends, and their concentrated buying activity is generally seen as a key signal of a medium- to long-term uptrend.

UTXO (Unspent Transaction Output) is the most fundamental accounting unit in Bitcoin. It can be regarded as “change” that has not yet been spent and is controlled by the private key of the corresponding address until it is used in the next transaction. This mechanism ensures transparency and traceability of the blockchain and is the core of Bitcoin’s decentralized structure. The total number of UTXOs reflects on-chain activity. An increase usually indicates a rise in transaction frequency, more new addresses, or more dispersed funds, representing a more active network. A decrease might suggest transaction consolidation, fewer users, or a wait-and-see market, signalling declining usage.
According to Glassnode on-chain data, since April 11, the net growth of UTXOs has continued to turn positive, with a clear increase in green bars, indicating that network activity is gradually recovering and on-chain transactions are becoming more frequent. Meanwhile, the total number of UTXOs has also begun to rise, echoing the upward trend in Bitcoin price. This may suggest that the market is entering a new growth cycle or an early recovery phase. This metric is an important indicator of capital flow and user engagement and is often seen as a leading signal of market sentiment and on-chain health.
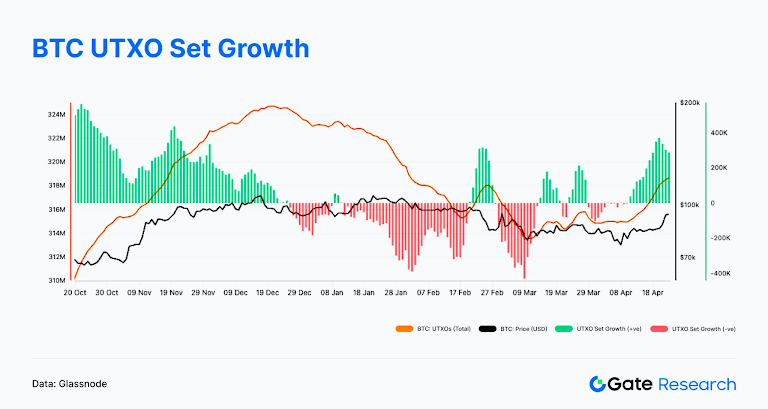
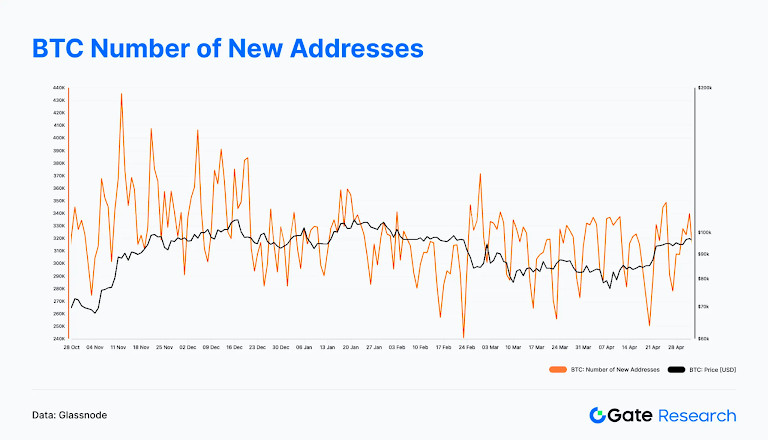
Notably, although UTXO net growth turned positive in April, reflecting increased on-chain transaction activity, the number of new addresses did not see a significant rise. According to Glassnode, the number of new addresses during April largely remained within the range of 300,000 to 350,000 per day, without any notable breakout. This suggests that the current on-chain recovery is driven more by the return and increased activity of existing users rather than by an influx of new investors.
This structural characteristic indicates that the market is still in a repair phase dominated by incumbent users, with new user adoption yet to show a clear expansion trend. Although overall on-chain metrics are improving, sustained price appreciation will require close monitoring of whether new address growth picks up alongside rising prices, as a way to validate whether the market has entered a new phase driven by incremental capital inflows.
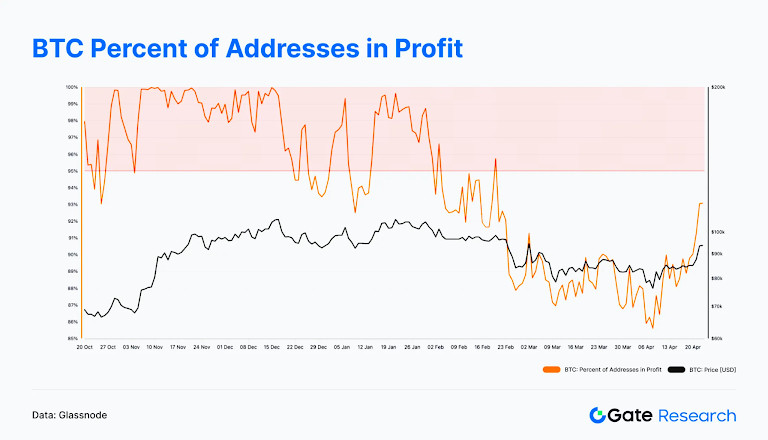
As existing users return and increase their interaction frequency, market sentiment has gradually improved alongside the price rebound. This can be further observed through changes in the percentage of addresses in profit. According to Glassnode, during the recent Bitcoin price rebound, the proportion of addresses holding coins at a profit has risen in parallel. This metric—Percentage of Addresses in Profit—represents the proportion of addresses where the current price exceeds the average purchase price, serving as a gauge of the market’s overall profitability status.
The chart shows that since mid-April, as Bitcoin prices climbed, this ratio has rapidly rebounded and now stands at 93%. This means that the majority of investors have returned to a profitable state, and the unrealised losses from earlier corrections are quickly diminishing. This trend typically indicates that market sentiment is shifting from pessimism toward neutrality or even mild optimism. Such an environment can help spur new buying momentum, although it may also be accompanied by some profit-taking. If prices continue to hold at elevated levels and drive this ratio even higher, the market may be entering the early stage of a new upward cycle.
On-chain activity in April exhibited divergence across ecosystems. Solana maintained its dominance in both transaction volume and gas revenue, showcasing its robust Layer 1 capabilities. Base and Sui saw a rise in activity, signalling emerging potential. Ethereum, while leading in capital inflows, saw relatively stable on-chain activity, whereas networks like Berachain and Polygon PoS faced capital outflow pressures. Overall, leading chains consolidated their positions while competition among emerging chains intensified.
Aggregated on-chain data suggests that Bitcoin is currently in the early stages of a structural rebound, with large holders re-entering and steadily accumulating positions, acting as a major driver of the recent price recovery. UTXO net growth has turned positive since mid-April, with both transaction frequency and network activity rising in parallel, indicating a recovery in on-chain momentum. However, Glassnode data shows that new address growth remained flat in April, hovering between 300,000 and 350,000 per day. This implies that the current recovery is still primarily driven by existing users rather than new capital inflows.
At the same time, the percentage of addresses in profit rapidly rebounded to 93%, reflecting that most investors have returned to a profitable state. Panic sentiment has subsided, and overall market mood is gradually shifting toward neutrality and mild optimism. If both price and on-chain activity continue to strengthen, accompanied by an uptick in new user growth, the market may see additional inflows and enter the next leg of its upward cycle.
Trending Projects & Token Activity
On April 16, Raydium, the leading decentralized exchange in the Solana ecosystem, officially launched its token issuance platform, LaunchLab, offering creators and developers a low-barrier, censorship-free tool for on-chain token launches and liquidity initialization. Users can issue tokens using various pricing curves (linear, exponential, logarithmic) and quote assets (such as SOL), with integration into AMM V4 and token locking mechanisms. Creators can also continue to receive 10% of AMM trading fees even after their tokens “graduate.”
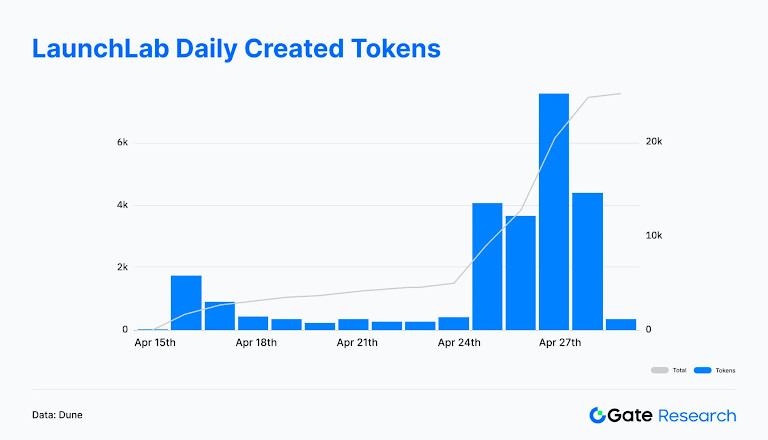
In the nearly two weeks since its launch, as of April 28, LaunchLab had created a total of 25,207 tokens, of which only 211 (0.84%) successfully raised funds and moved into AMM liquidity pools, indicating a high threshold for success. Token creation peaked on April 27, with over 7,500 tokens created in a single day; meanwhile, the highest number of graduating tokens appeared on April 25 and 26, with more than 110 tokens graduating over those two days. Overall, while LaunchLab has lowered the threshold for token issuance, the success of projects still heavily depends on team strength and market recognition.
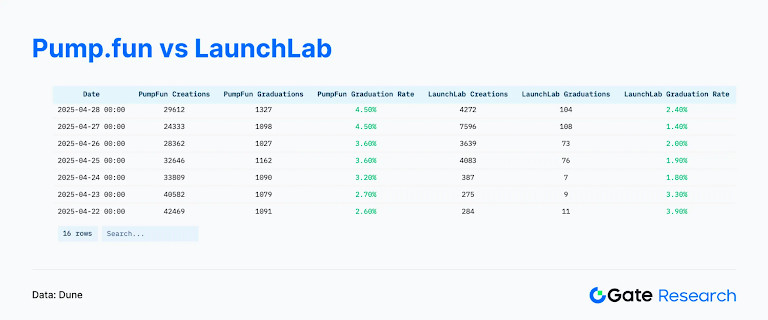
As of April 28, there was a clear contrast between the two main token issuance platforms on the Solana chain:
- Pump.fun created 29,612 tokens, with 1,327 successfully graduating — a graduation rate of 4.5%.
- Raydium’s LaunchLab created 4,272 tokens, with 104 successfully graduating — a graduation rate of 2.4%, significantly lower than Pump.fun.
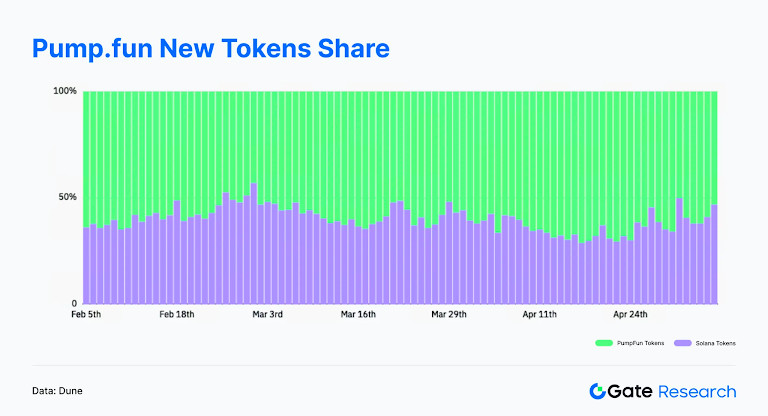
Pump.fun has long dominated the majority share of new token issuance on the Solana network. Even after LaunchLab’s debut, Pump.fun maintained a high market share. Particularly in early March and late April, Pump.fun’s daily issuance share exceeded 65%, underscoring its continued leadership in both issuance volume and user activity. While LaunchLab offers more flexible issuance mechanisms and economic incentives, Pump.fun remains the leading token issuance platform on Solana in terms of penetration and market dominance.
Overall, LaunchLab, as a newly launched token issuance platform by Raydium, has rapidly attracted a large number of creators and project teams, demonstrating strong ecosystem appeal and on-chain innovation vitality. Although its graduation rate is still at an early stage, the platform has successfully lowered issuance barriers, diversified Solana’s on-chain applications and assets, and laid a solid foundation for the incubation and growth of future quality projects. As market mechanisms improve and the community matures, LaunchLab is expected to become an important driver for financial innovation and user engagement on the Solana blockchain.
$TRUMP — The TRUMP token is a meme coin themed around a political figure, deployed on high-performance blockchains such as Solana. It is favoured by developers due to its low transaction costs and easy issuance mechanism. The token is derived from the public image of the current U.S. President Donald Trump, and is widely used in the PolitiFi (political finance) sector. By blending community culture, trending topics, and social media marketing, it has successfully captured market attention.
The latest surge in $TRUMP’s price was largely driven by market news. On April 24, President Trump announced he would host a dinner in May at a golf club near Washington D.C. for the top 220 holders of $TRUMP, with an exclusive reception and White House tour offered to the top 25 holders. The announcement quickly went viral on social platforms, igniting market sentiment and driving the token’s price up over 50% within a short period, positioning it as one of the hottest meme coins of the season.
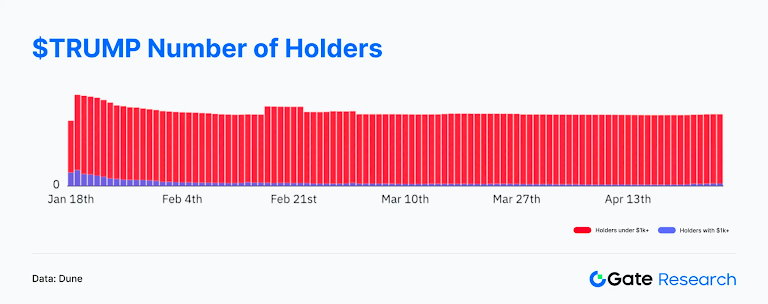
This event not only significantly increased $TRUMP’s on-chain activity but also renewed interest in the PolitiFi sector’s potential. Investors began actively competing for ranking in token holdings and paying close attention to whether similar benefit-based incentives would appear in the future. On-chain data shows that since the announcement on April 24, the number of addresses holding more than $1,000 worth of $TRUMP rose from approximately 18,000 to 21,900 — an increase of over 21%. The total number of token-holding addresses also climbed from 640,000 to 643,000, further proving that market enthusiasm had expanded from the core community to a broader user base. This demonstrates the strong viral and attractive power of political meme coins when driven by topical events.
Notably, according to Chainalysis, since its launch, the $TRUMP token’s founding team has amassed over $320 million in revenue from transaction fees, reflecting not only its hype-driven appeal but also its substantial capital-generation capacity. On May 5, Trump once again promoted the upcoming May 22 dinner, further fueling market attention and narrative momentum. This phenomenon underscores the diversification of capital flows in crypto markets while serving as a reminder for investors to maintain risk awareness and carefully assess the long-term value and sustainability of such high-volatility assets.
Disclaimer
In line with the Trust Project guidelines, please note that the information provided on this page is not intended to be and should not be interpreted as legal, tax, investment, financial, or any other form of advice. It is important to only invest what you can afford to lose and to seek independent financial advice if you have any doubts. For further information, we suggest referring to the terms and conditions as well as the help and support pages provided by the issuer or advertiser. MetaversePost is committed to accurate, unbiased reporting, but market conditions are subject to change without notice.
About The Author
Alisa, a dedicated journalist at the MPost, specializes in cryptocurrency, zero-knowledge proofs, investments, and the expansive realm of Web3. With a keen eye for emerging trends and technologies, she delivers comprehensive coverage to inform and engage readers in the ever-evolving landscape of digital finance.
More articles

Alisa, a dedicated journalist at the MPost, specializes in cryptocurrency, zero-knowledge proofs, investments, and the expansive realm of Web3. With a keen eye for emerging trends and technologies, she delivers comprehensive coverage to inform and engage readers in the ever-evolving landscape of digital finance.


