Past Week in Crypto: Bitcoin’s Bearish Cycle and Ethereum’s ETF Setbacks


In Brief
Bitcoin struggled with bearish momentum, Ethereum faced setbacks with ETF applications, and Toncoin showed mixed performance amid broader market pressures.

Kicking off around September 2, BTC tried to claw back some gains, eyeing the $60,000 mark as a foothold. But with traders on edge and eyes locked on potential US rate cuts, the market couldn’t shake its cautious “wait-and-see” vibe.
Source: CryptoQuant
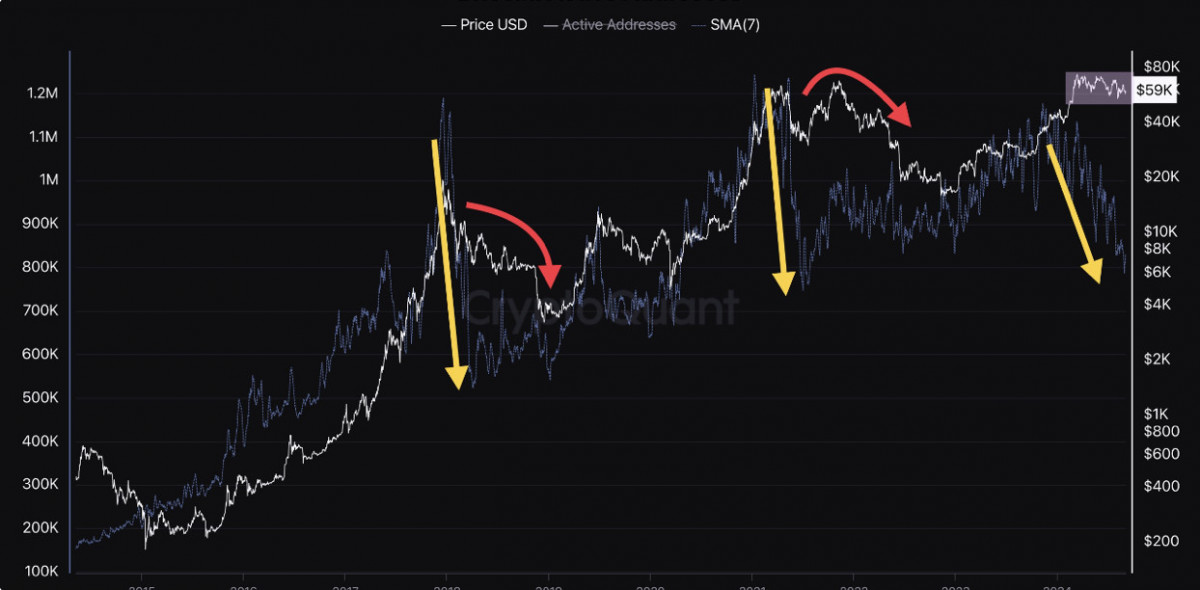
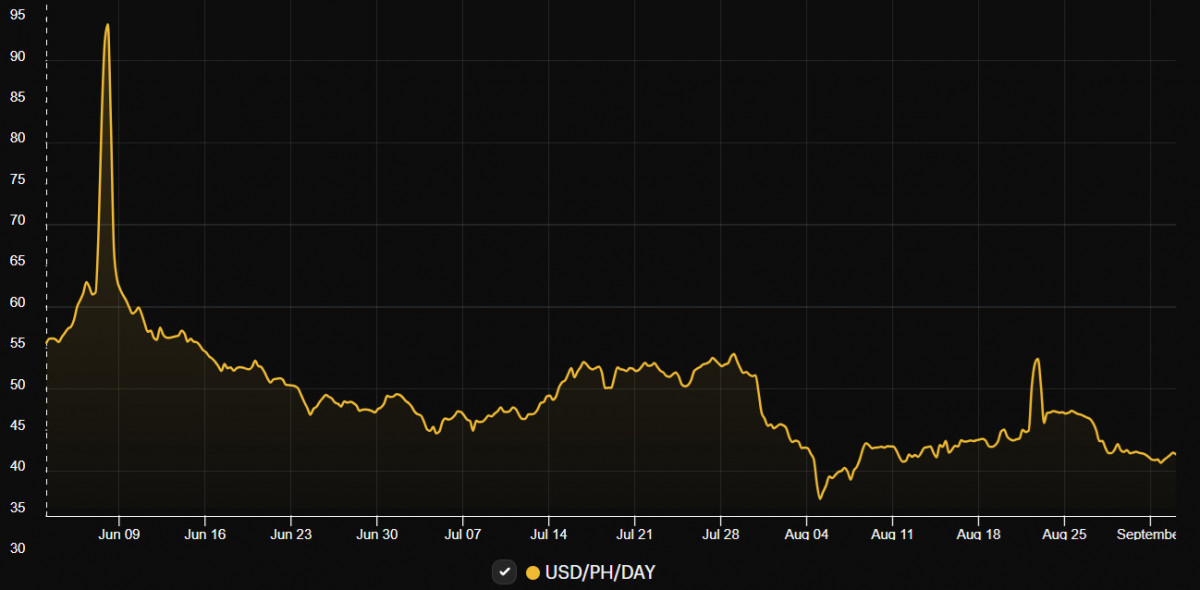
Investor jitters were stoked further by declining active address numbers and shrinking institutional inflows, signaling that many heavyweights were hitting pause. Bitcoin’s price direction grew hazy, with talks of a potential slide toward $40,000 gaining traction. Miners weren’t faring any better – September marked their worst revenue streak in nearly a year, adding to the pressure cooker vibe.
Source: Hashrateindex
As the week wrapped, bearish momentum picked up speed. ETF outflows and hefty spot market sell-offs kept the downside risk alive. Even with fleeting moves near $60,000, sentiment stayed firmly on the defensive.
BTC Price Analysis
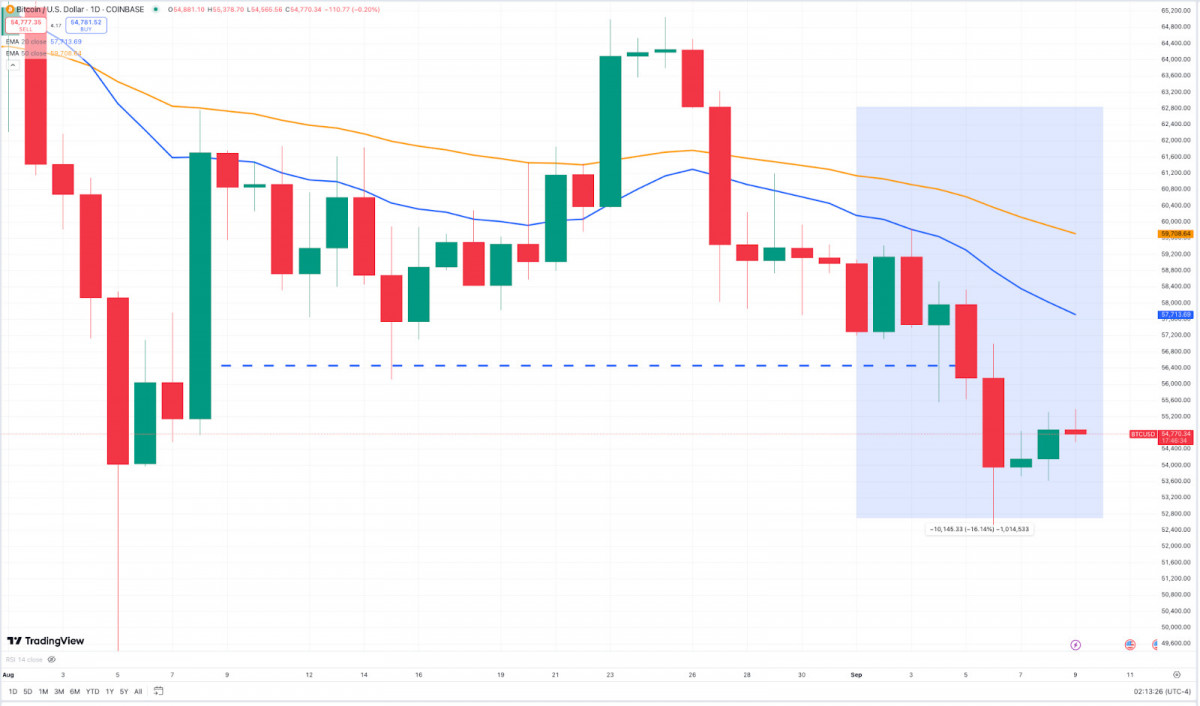
Bitcoin’s price action this past week was a battle between hopeful buyers and relentless sellers. On the daily chart, BTC slipped under the crucial $58,000 level early on, turning previous support into a stubborn resistance. The blue zone captures the sell pressure as every bounce met fierce rejection, with a sharp drop below $55,000 setting the tone for a bearish week.
Source: TradingView
On the 4H chart, the downtrend was even clearer: consistent lower highs and lows with the 50-EMA acting as a ceiling. The RSI hovered near oversold, suggesting bearish control but also signs of exhaustion. Attempts to reclaim key support zones like $54,000 were weak, reflecting a market hesitant to commit amid fears of deeper drops.
Source: TradingView
The $54,000 level has become a critical battleground; lose it, and BTC could slide further. Reclaim it, and we might see a run back towards $56,000. For now, the charts are screaming caution as traders brace for potential further downside.
Ethereum News & Macro
The standout narrative is ETH’s dip into the red for 2024, losing 42% of its gains amid broader market sell-offs. The bearish vibes aren’t just about macro headwinds, though – they’re also fueled by some frustrating news on the institutional front.
Source: farside.co.uk
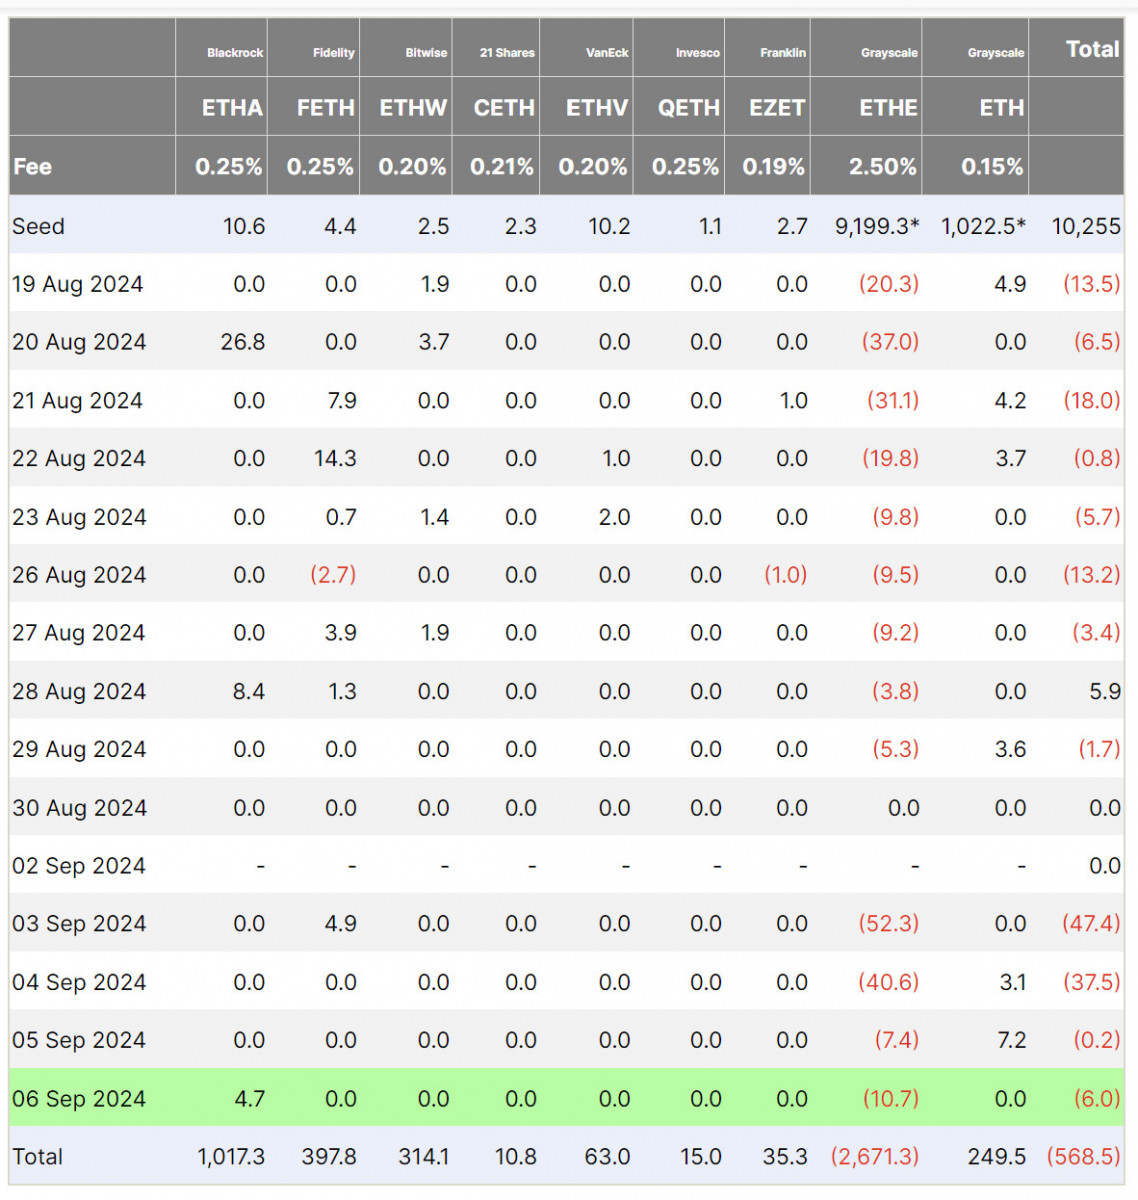
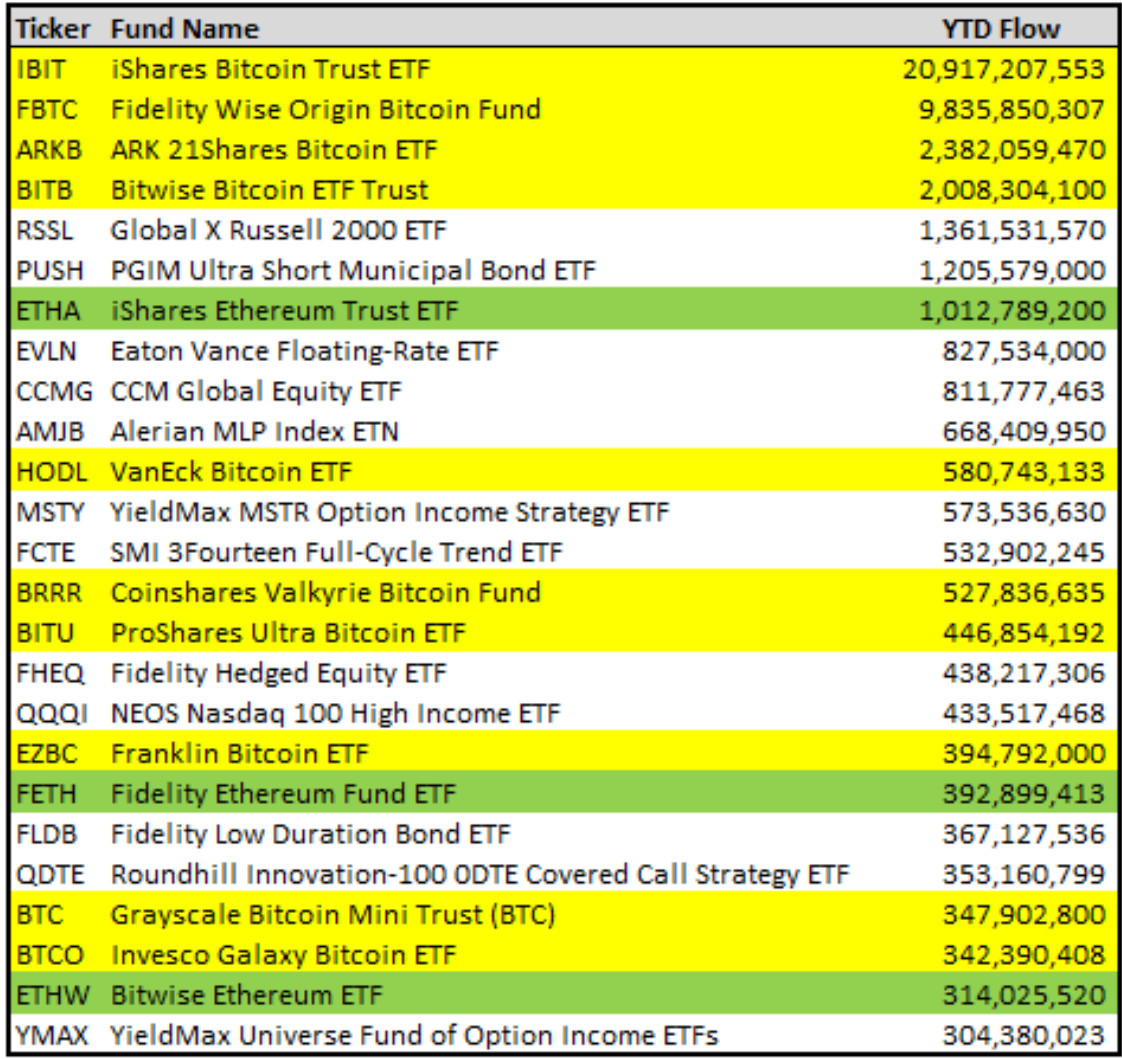
On September 7, WisdomTree made headlines by yanking its Ethereum spot ETF application with the SEC, citing the fee as a “future use” issue. This move crushed hopes for a near-term influx of institutional capital, underscoring the regulatory murkiness that continues to spook investors.
Source: The ETF Store
It wasn’t just WisdomTree throwing in the towel; VanEck decided to shutter its Ethereum futures ETF, signaling a lukewarm stance from institutional players towards futures-based products when all eyes are on spot markets.

Source: Token Terminal
Compounding these concerns, Ethereum’s Layer-1 network revenue has taken a nosedive. Despite a spike in daily active users and transaction counts, Token Terminal data shows network revenue has halved since March. So, high activity isn’t necessarily translating to big bucks.
There were some glimmers of tech optimism, like Movement Labs pushing Ethereum’s capabilities to 12K transactions per second on its testnet – an impressive feat, sure, but one that didn’t do much to lift market spirits in the short term. The current sentiment is clear: traders are locked on immediate price impacts and aren’t giving long-term upgrades their due attention.
ETH Price Analysis
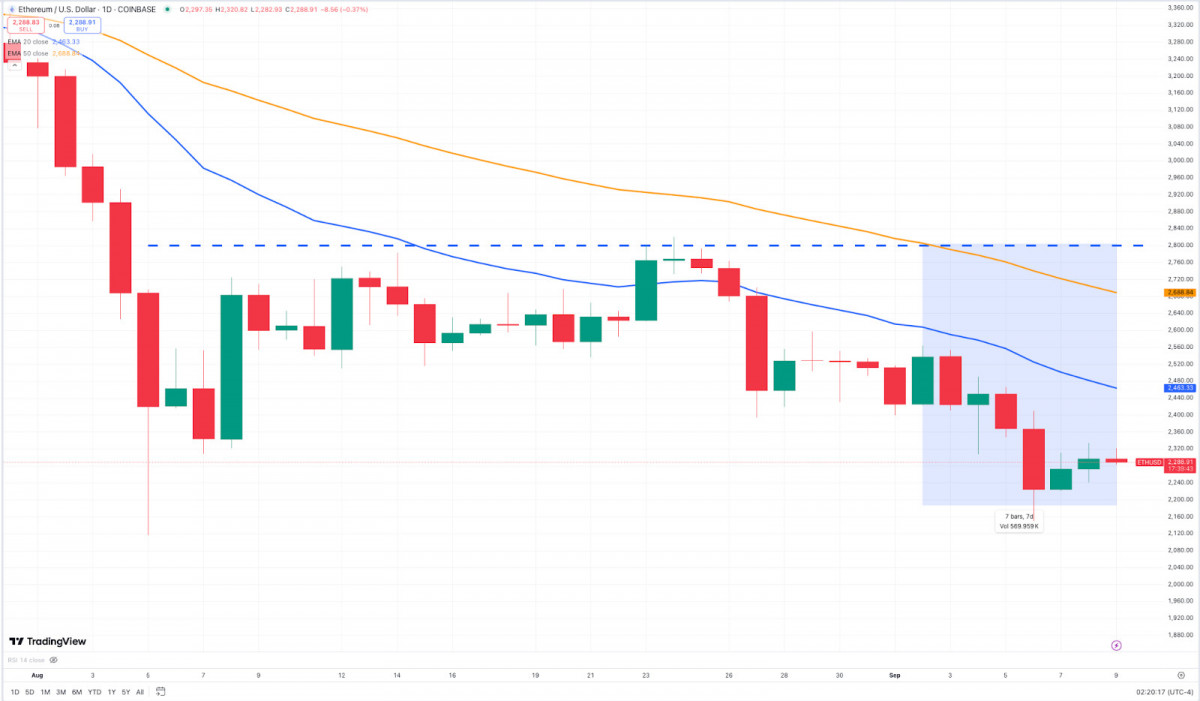
Ethereum’s price action this past week has been a grind under heavy bearish pressure. On the 1D chart, ETH broke down from the $2,480 support, a key level that had held for weeks, confirming sellers are in control. The 20-EMA is sharply sloping down, reinforcing the bearish trend, while the 50-EMA hovers above, adding weight to any rally attempts.
Source: TradingView
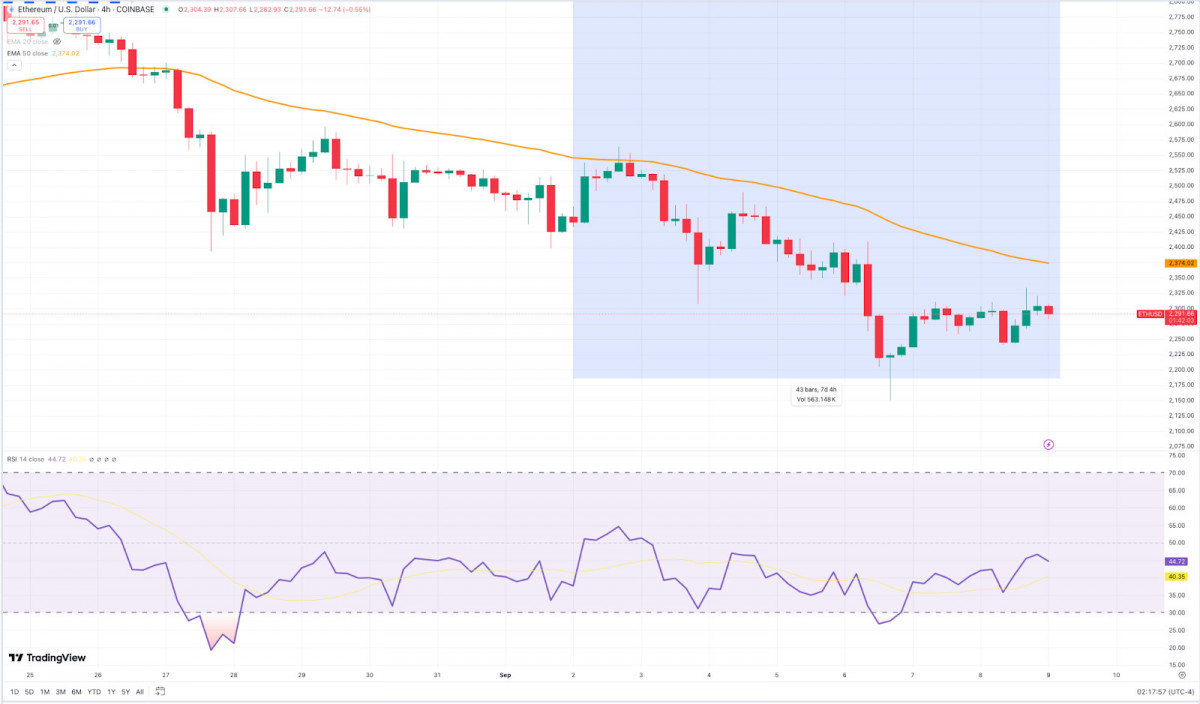
On the 4H chart, ETH is stuck in a bearish channel, marked by lower highs and lows. Brief rallies have been capped near $2,440 – once strong support, now acting as stubborn resistance. The RSI hovers in bearish territory, showing no signs of strong buying interest. A bearish flag is forming, hinting at potential continuation lower unless buyers step up.
Source: TradingView
With the news backdrop of regulatory setbacks and ETF withdrawals, sentiment remains cautious. Key levels like $2,480 need reclaiming to flip the script, but until then, the market feels stuck, with sellers keeping the upper hand.
Toncoin News & Macro
TON has been in the spotlight with some major moves this week, setting the stage for potential market shifts.
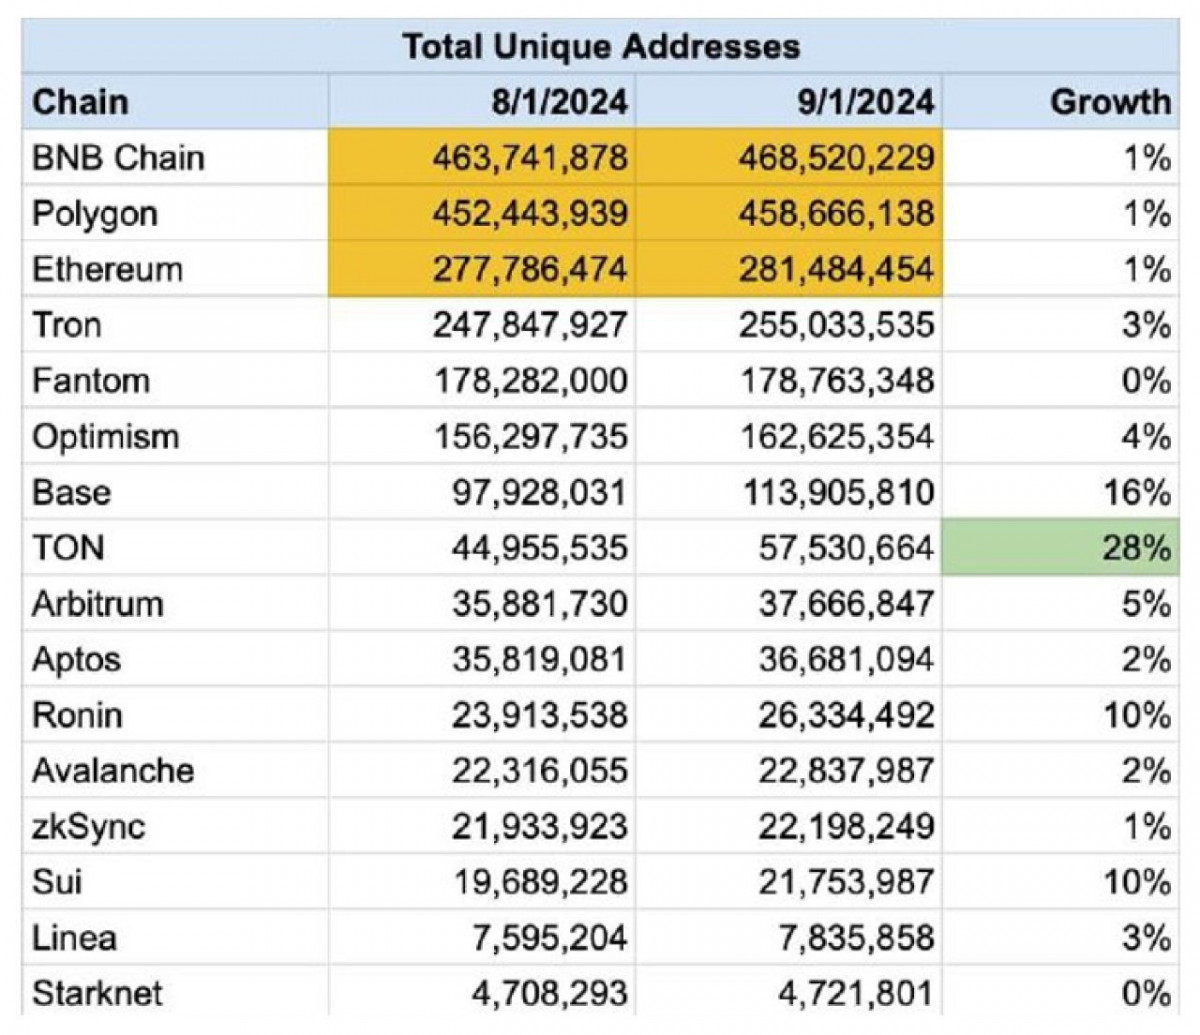
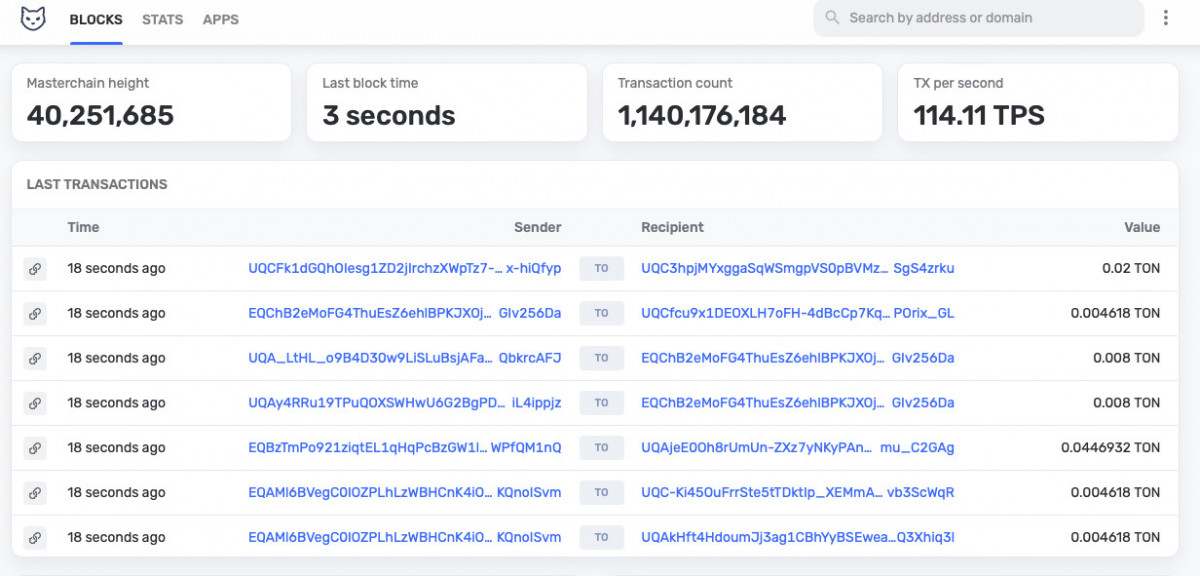
The network blew past its competitors in unique address growth, notching a 28% rise in just a month with 12.5 million new addresses – leaving Ethereum, Polygon, and BNB Chain in the dust. This upswing in user engagement coincided with TON crossing the 1 billion transactions mark, with half of those packed into the last three months, underscoring the network’s accelerating activity.
Source: Tronscan
On the investment front, TON rolled out a new accelerator program, promising up to $2.5 million each for five standout projects. It’s a clear play to boost innovation and attract fresh talent into the ecosystem. The TON Foundation also injected an extra $24 million into DeFi projects, aiming to expand its reach and draw more liquidity into its decentralized finance scene.
Meanwhile, the Durov drama is adding suspense. French authorities claim Telegram’s lack of moderation turned it into a magnet for criminal activity. Even though Durov was released on bail, he is banned from leaving France until further notice.
TON Price Analysis
Now let’s dive into TON’s latest price action. On the daily chart, TON’s been grinding lower, breaking down past the $6.00 support with heavy selling pressure that’s boxed it into a tight range around $4.60 to $4.90. The 20-day and 50-day EMAs are sloping down, acting like a ceiling over any attempts to bounce back, clearly reinforcing the ongoing downtrend. The recent price moves have been pretty muted – small-bodied candles hint at indecision and some quiet accumulation, but without the volume punch needed for any real reversal.
Source: TradingView
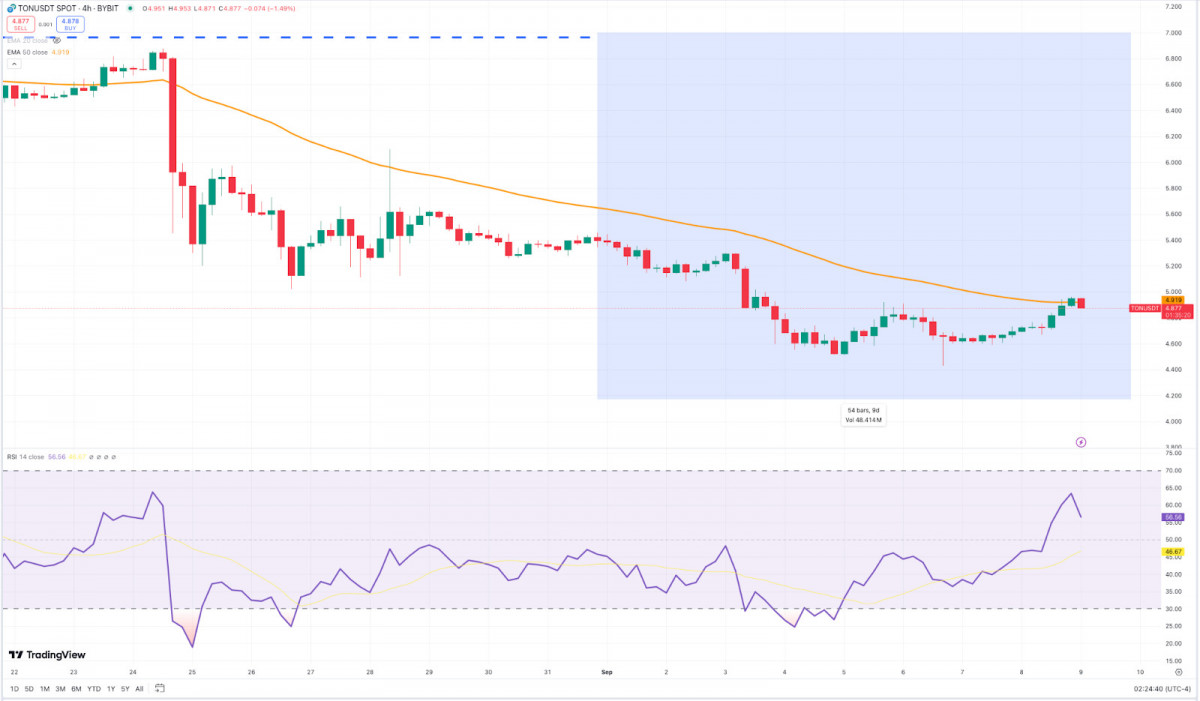
Flipping to the 4-hour chart, it’s more of the same bearish vibe. The price keeps getting smacked down at key levels like $5.50, with the 50 EMA acting as a stubborn barrier. Even when the RSI dips into oversold territory and sparks a quick rebound, those moves fizzle fast. The latest action around the $4.90-$5.00 zone shows a bit of a pause, suggesting the sellers might be taking a breather, but the broader downtrend hasn’t let up. Overhead resistance is still looming large, and any rally attempts are going to have to fight through that thick layer of supply.
Source: TradingView
TON’s at a tipping point here. If it can punch through resistance around $5.50, we might see some upside momentum, but for now, the bears are still calling the shots.
Disclaimer
In line with the Trust Project guidelines, please note that the information provided on this page is not intended to be and should not be interpreted as legal, tax, investment, financial, or any other form of advice. It is important to only invest what you can afford to lose and to seek independent financial advice if you have any doubts. For further information, we suggest referring to the terms and conditions as well as the help and support pages provided by the issuer or advertiser. MetaversePost is committed to accurate, unbiased reporting, but market conditions are subject to change without notice.
About The Author
Victoria is a writer on a variety of technology topics including Web3.0, AI and cryptocurrencies. Her extensive experience allows her to write insightful articles for the wider audience.
More articles

Victoria is a writer on a variety of technology topics including Web3.0, AI and cryptocurrencies. Her extensive experience allows her to write insightful articles for the wider audience.


