Weekly Crypto Beat: Market Reactions and Price Predictions for BTC, ETH, TON


In Brief
Over the past week, Bitcoin’s price has been pressured by large-scale sell-offs from Mt. Gox creditors and the German government, Ethereum faced bearish trends despite increased DApp activity and anticipation for ETFs, and Toncoin saw a price surge driven by new blockchain integrations and gaming initiatives, though it too faced resistance in a predominantly bearish market.

Bitcoin News & Macro
Here’s a rundown of what’s moved the price of Bitcoin over the past week. The Mt. Gox saga intensified as creditors shifted massive amounts of Bitcoin, rattling market confidence. With over $2.7 billion in Bitcoin moved to a new wallet, fears of large-scale sell-offs started to loom.

Source: Arkham Intelligence
Adding to the pressure, the German government continued its Bitcoin sell-off, unloading over $2.3 billion.
Source: Arkham Intelligence
This steady supply influx hit market sentiment hard, with traders bracing for more declines as the selling continued.
Despite the gloom, some bullish notes emerged. Analysts hinted at potential rebounds with the anticipated approval of Bitcoin ETFs. Yet, skepticism lingers, especially with weak tech earnings and broader economic pressures weighing down optimism.
BTC Price Analysis
With that in mind, let’s take a quick look at BTC’s price behavior since July 1. A sharp sell-off led into the week, breaking from the $63,000 level and slicing through $60,000 support, hitting a local bottom near $54,000. This area became a battleground as buyers stepped in to grab what they saw as discounted BTC.
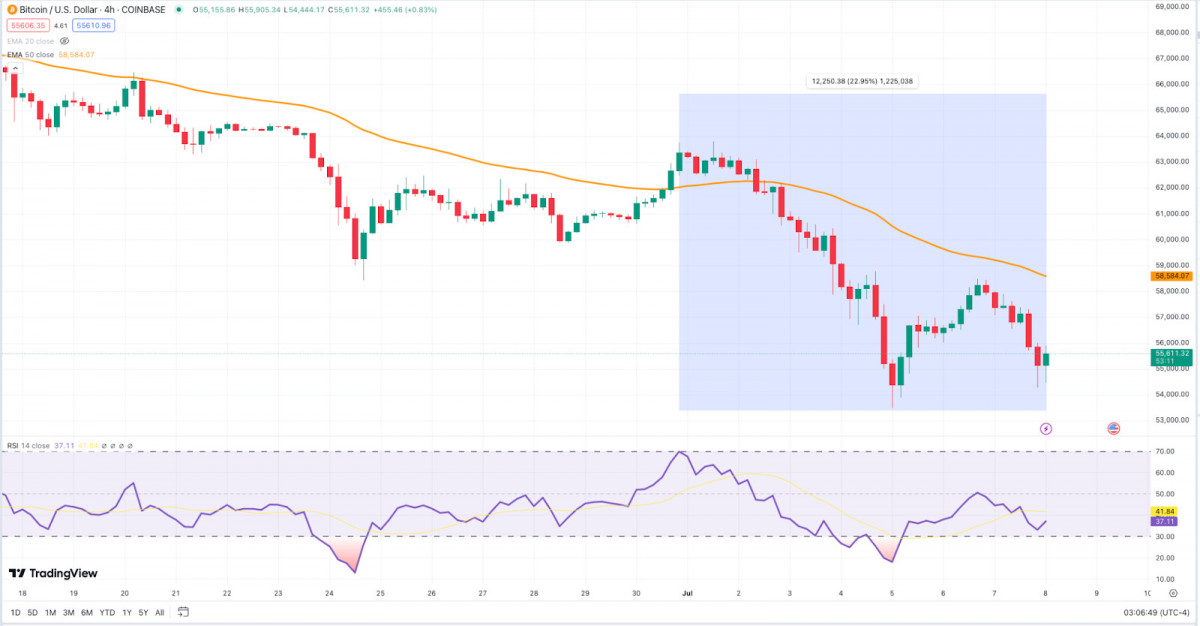
Coinbase. Source: TradingView
However, the rebound hit stiff resistance around $58,000, aligning with the 50-EMA on the 4-hour chart. This zone acted as a ceiling, confirmed by the RSI hovering in bearish territory, failing to consistently break above the midline.

Source: TradingView
Zooming out to the daily chart, the sell-off fits into a larger downtrend that began in mid-June. The daily candles show lower highs and lower lows, classic bearish signs. The EMAs underscore this bearish dominance, with the 20-EMA crossing below the 50-EMA, signaling the potential for more downside.
Source: TradingView
The breakdown from $63,000 revisited early March support levels, with $55,000 as a significant pivot. This level, previously acting as both support and resistance, became a psychological anchor for traders. Closing below this level daily added to bearish sentiment, leading to more selling pressure. Last week’s open near $60,000 quickly turned into resistance, and daily closes below $58,000 confirmed a bearish bias. This pressure led to further breakdowns, with brief consolidations followed by more selling.
Looking forward, traders should watch the $55,000 support. A break below this could lead to further declines, targeting the $52,000 and $50,000 levels. Reclaiming $58,000 would be a bullish step, with $60,000 as the next major hurdle.
Ethereum News & Macro
This past week, Ethereum (ETH) has been a mix of bullish hopes and bearish fears. For one, DApp volume skyrocketed by 83%, thanks to a single app driving network activity. Despite this spike, the unusually low fees for both Bitcoin and Ethereum raised eyebrows about market stability.
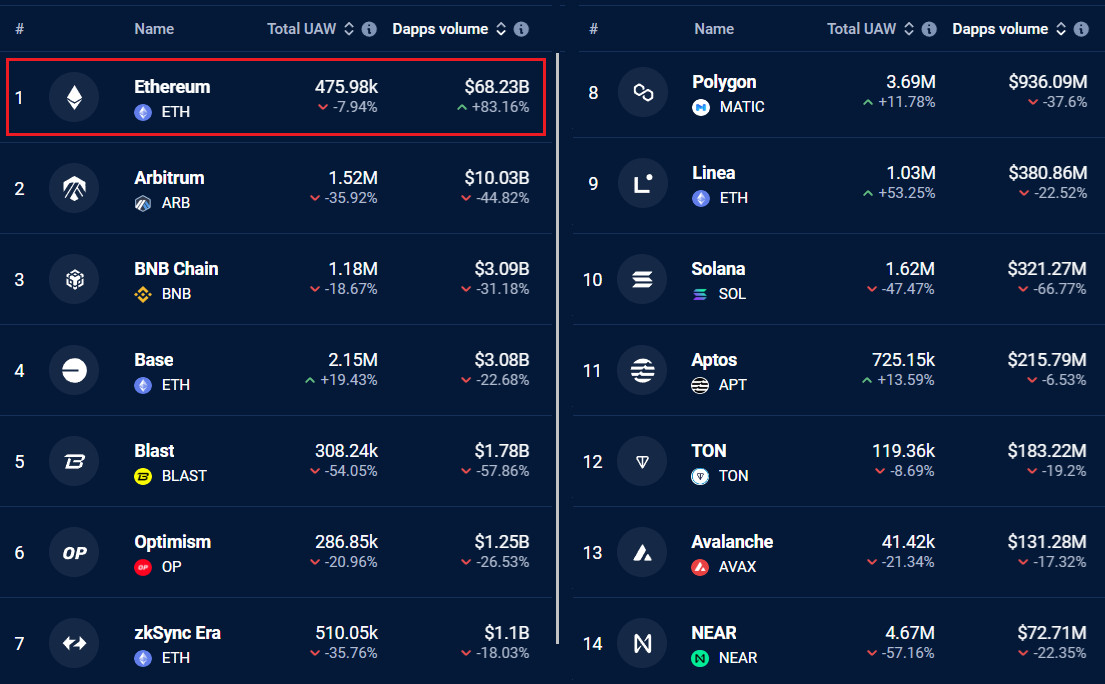
Source: DappRadar
Anticipation of Ethereum ETFs fueled investor excitement, with approval expected soon.
Vitalik Buterin’s proposal for faster trades through single-slot finality aimed to boost network efficiency, adding a positive note. Yet, U.S. regulatory uncertainty and Bitcoin’s sell-off pressured ETH, dropping it below critical support.
ETH Price Analysis
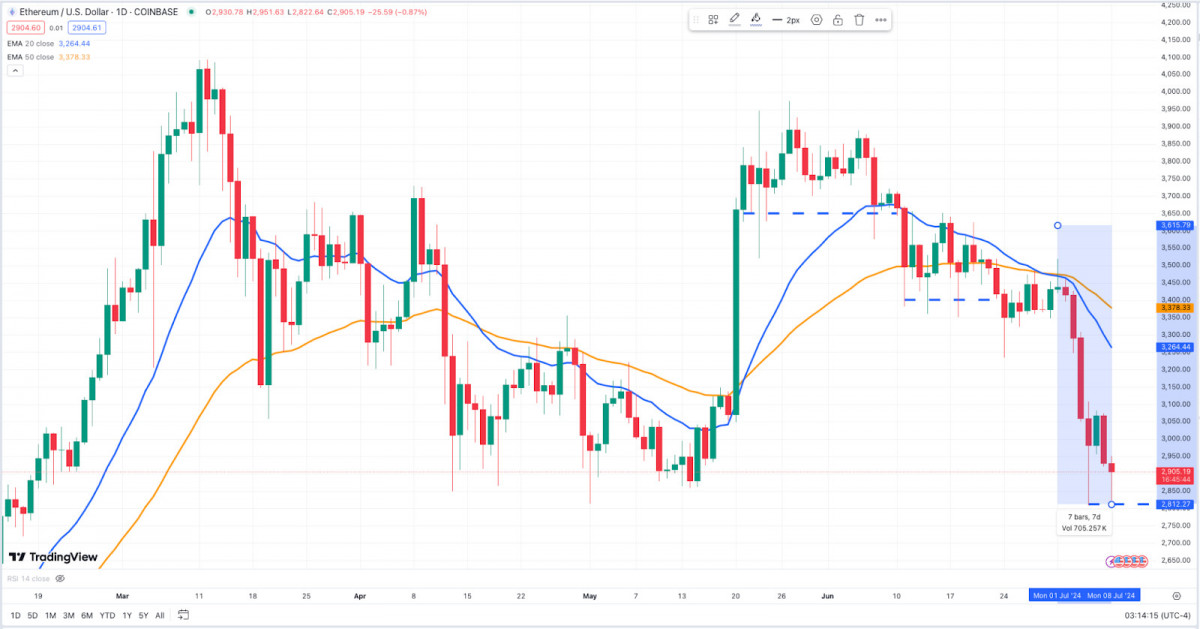
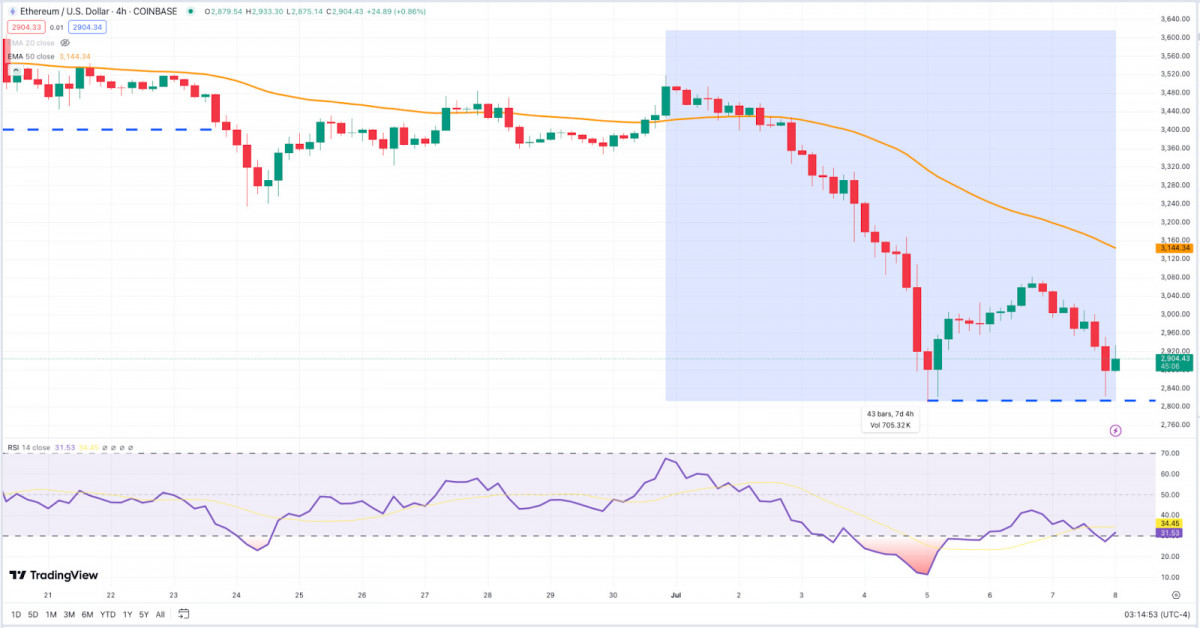
The past week’s ETH price action kicked off with a decisive plunge into the red, breaking through the $3,400 support and heading straight for $2,800. As you’d expect, this breakdown mirrored BTC’s earlier dive.
Source: TradingView
The initial sell-off was relentless, plummeting ETH to just above $2,800, where it found temporary support. This level became a critical zone, sparking a brief rebound as buyers attempted to stabilize the price. However, similar to BTC, this rebound was met with resistance around $3,160, aligning with the 50-EMA on the 4-hourly. This zone acted as a formidable barrier, turning the rebound into a consolidation phase rather than a full-fledged recovery.

Source: TradingView
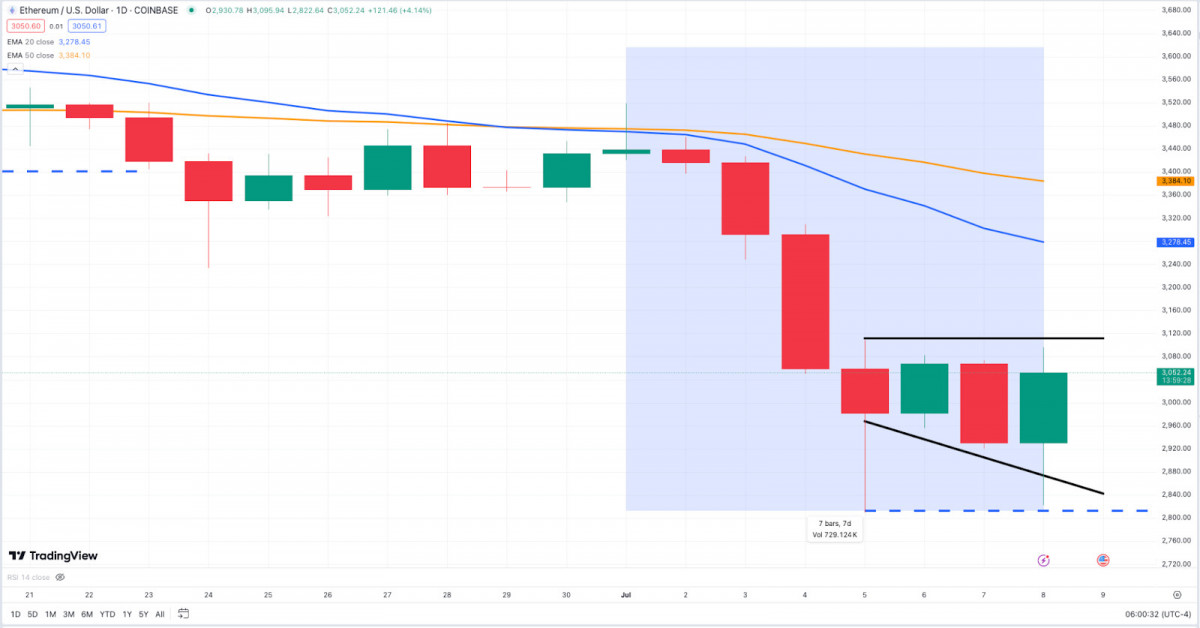
On the daily chart, ETH has been consistently making lower highs and lower lows, indicating a bearish trend. The EMAs reinforce this narrative, with the 20-EMA crossing below the 50-EMA, suggesting sustained bearish momentum.
The $3,400 level, which once acted as strong support, has now turned resistance, amplifying the bearish pressure. The failure to reclaim this level on daily closes adds to the selling momentum.
Source: TradingView
Pattern-wise, the daily chart spells a descending triangle, with the horizontal support at $2,800 and a series of lower highs. This pattern typically precedes further bearish action unless there’s a significant breakout above the upper trendline.
Moving forward, $2,800 support is crucial. A decisive break below this level could see ETH testing lower levels like $2,600. Conversely, reclaiming $3,160 would be a bullish signal, with $3,400 being the next roadblock.
Toncoin News & Macro
In the past week, Toncoin (TON) has seen a surge in momentum, shaking up its market perception and price. Cobo’s integration of the TON blockchain has ramped up digital asset security, drawing in institutional clients and sparking yet more interest in TON.
Meanwhile, Notcoin and Helika Gaming launched a $50 million Telegram Gaming Accelerator powered by TON. This has naturally boosted Toncoin’s appeal in the gaming world. Apart from that, TON has been mirroring the price behavior of other majors. Let’s look into that in detail.
TON Price Analysis
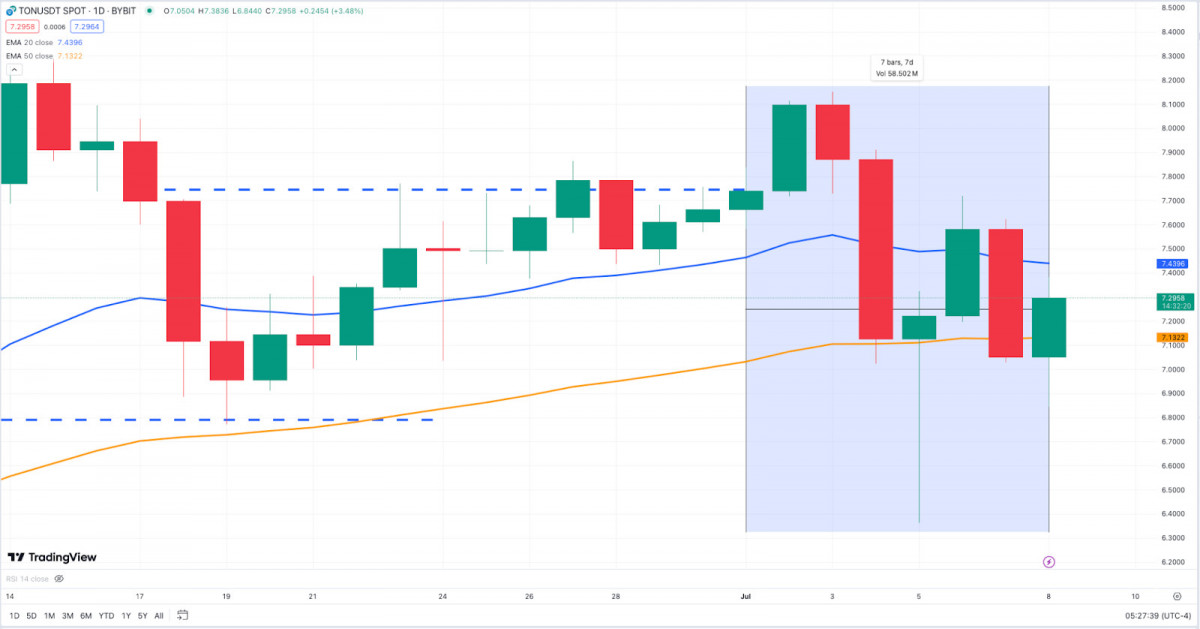
Early in the week, TON saw a sharp sell-off, dropping from $7.80 to a low of $6.60, mirroring the bearish trend in BTC and ETH. On the 4-hour chart, this drop tested the crucial $6.60 support level, echoing BTC’s struggle around $55,000 and ETH’s battle near $2,800.
The strong reaction at $6.60 spurred a rebound to $7.40, aligning with the 50-EMA, but this resistance led to consolidation.
Source: TradingView
Long wicks show bulls pushing back, but consistent rejection at the 50-EMA keeps bears in control.
Source: TradingView
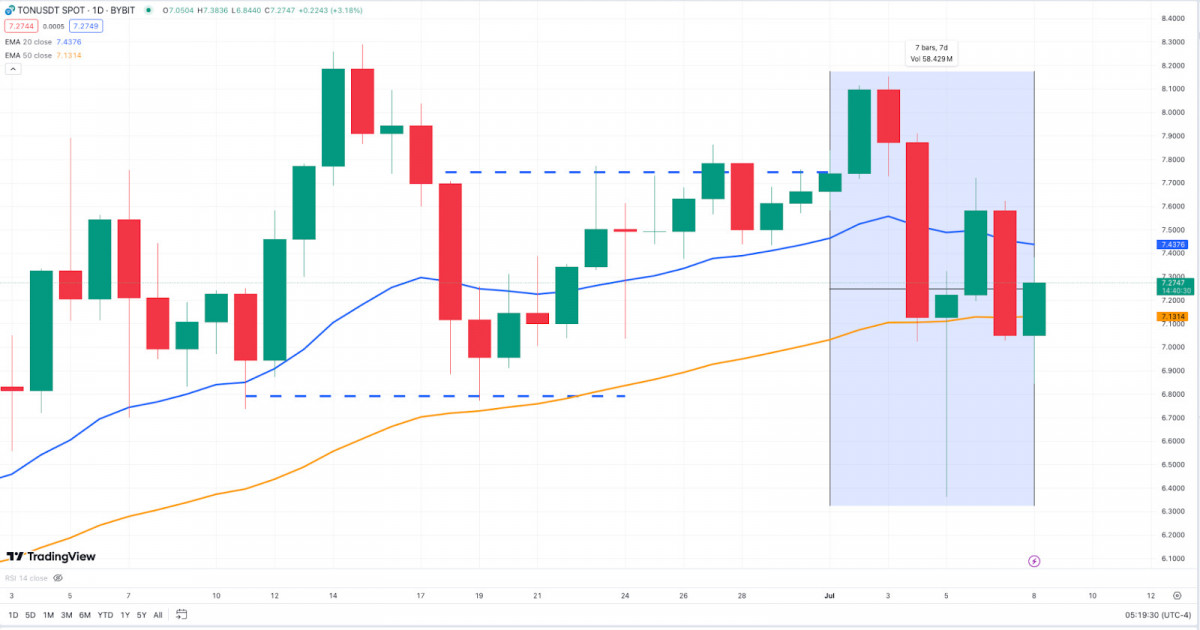
The week opened around $7.40, quickly faced selling pressure, and briefly breached $7.00. Recovery attempts met resistance at $7.40, confirming a bearish bias. The daily chart suggests a descending channel, indicating further downside unless TON breaks above the upper trendline. For now, the 20-EMA is trading above but gradually sloping towards the 50-EMA, reinforcing the lack of vigor in bulls.
Looking forward, keep an eye on the $6.60 support level. A break below could lead to further declines, potentially testing $6.00. Reclaiming $7.40 would signal bullish strength, at least for the time being.
Disclaimer
In line with the Trust Project guidelines, please note that the information provided on this page is not intended to be and should not be interpreted as legal, tax, investment, financial, or any other form of advice. It is important to only invest what you can afford to lose and to seek independent financial advice if you have any doubts. For further information, we suggest referring to the terms and conditions as well as the help and support pages provided by the issuer or advertiser. MetaversePost is committed to accurate, unbiased reporting, but market conditions are subject to change without notice.
About The Author
Victoria is a writer on a variety of technology topics including Web3.0, AI and cryptocurrencies. Her extensive experience allows her to write insightful articles for the wider audience.
More articles

Victoria is a writer on a variety of technology topics including Web3.0, AI and cryptocurrencies. Her extensive experience allows her to write insightful articles for the wider audience.


