Candlestick


What is Candlestick?
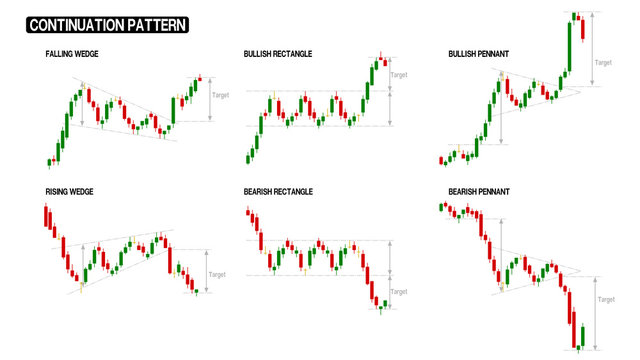
A candlestick price chart is a single bar that shows traders market changes at a glance. Each candlestick represents the open, low, high, and closing price of a market over a specific time period. Patterns forming on candlestick charts can assist traders in using technical analysis to predict market moves.
Understanding Candlestick
Candlestick charts can be changed to different time periods based on what the trader finds most useful. They have lengths ranging from one minute (meaning a new candle will form every minute) to one month. When looking for a trade entry, short-term traders will typically focus on the lower time frame candlesticks.
Read related articles:
« Back to Glossary IndexDisclaimer
In line with the Trust Project guidelines, please note that the information provided on this page is not intended to be and should not be interpreted as legal, tax, investment, financial, or any other form of advice. It is important to only invest what you can afford to lose and to seek independent financial advice if you have any doubts. For further information, we suggest referring to the terms and conditions as well as the help and support pages provided by the issuer or advertiser. MetaversePost is committed to accurate, unbiased reporting, but market conditions are subject to change without notice.
About The Author
Damir is the team leader, product manager, and editor at Metaverse Post, covering topics such as AI/ML, AGI, LLMs, Metaverse, and Web3-related fields. His articles attract a massive audience of over a million users every month. He appears to be an expert with 10 years of experience in SEO and digital marketing. Damir has been mentioned in Mashable, Wired, Cointelegraph, The New Yorker, Inside.com, Entrepreneur, BeInCrypto, and other publications. He travels between the UAE, Turkey, Russia, and the CIS as a digital nomad. Damir earned a bachelor's degree in physics, which he believes has given him the critical thinking skills needed to be successful in the ever-changing landscape of the internet.
More articles
Damir is the team leader, product manager, and editor at Metaverse Post, covering topics such as AI/ML, AGI, LLMs, Metaverse, and Web3-related fields. His articles attract a massive audience of over a million users every month. He appears to be an expert with 10 years of experience in SEO and digital marketing. Damir has been mentioned in Mashable, Wired, Cointelegraph, The New Yorker, Inside.com, Entrepreneur, BeInCrypto, and other publications. He travels between the UAE, Turkey, Russia, and the CIS as a digital nomad. Damir earned a bachelor's degree in physics, which he believes has given him the critical thinking skills needed to be successful in the ever-changing landscape of the internet.